The field of orthodontics has expanded to the point where expertise in a wide variety of health specialties is required to treat an orthodontic case to its highest potential.
A primary reason for this syllabus is that the piecemeal approach to management of an individual's oral health is no longer relevant. Many cases require a unified approach in which various orofacial specialists work toward a common goal. The key to insuring that all practitioners are operating harmoniously is a well conceived treatment plan.
Certainly planning is not unique to dentistry. One would not build a house at random; home construction begins with a detailed set of plans. A plan is more than just a design. It also allows communication and coordination among the entities who must work together to produce the result. Therefore, an appropriate dental treatment plan must coordinate the activities of the various clinicians involved in the case.
In the past two decades a vast body of treatment planning information has been placed at the disposal of the clinician. In this volume we have attempted to harness this sometimes overwhelming amount of material into a cohesive unit designed for everyday practical applications.
The method of static analysis presented herein enhances understanding of how a patient deviates from the normal pattern. Dynamic or functional analysis aids in the visualization and recognition of growth pattern changes.
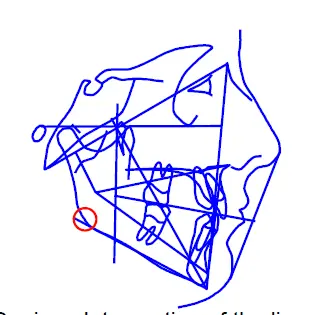
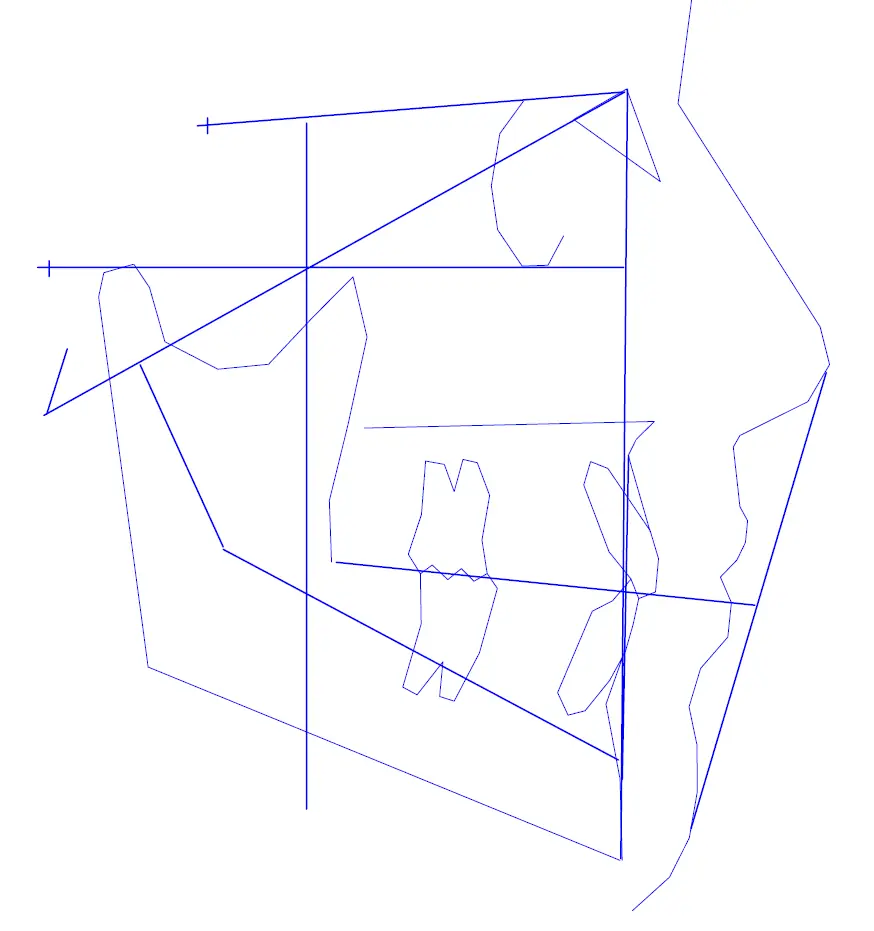
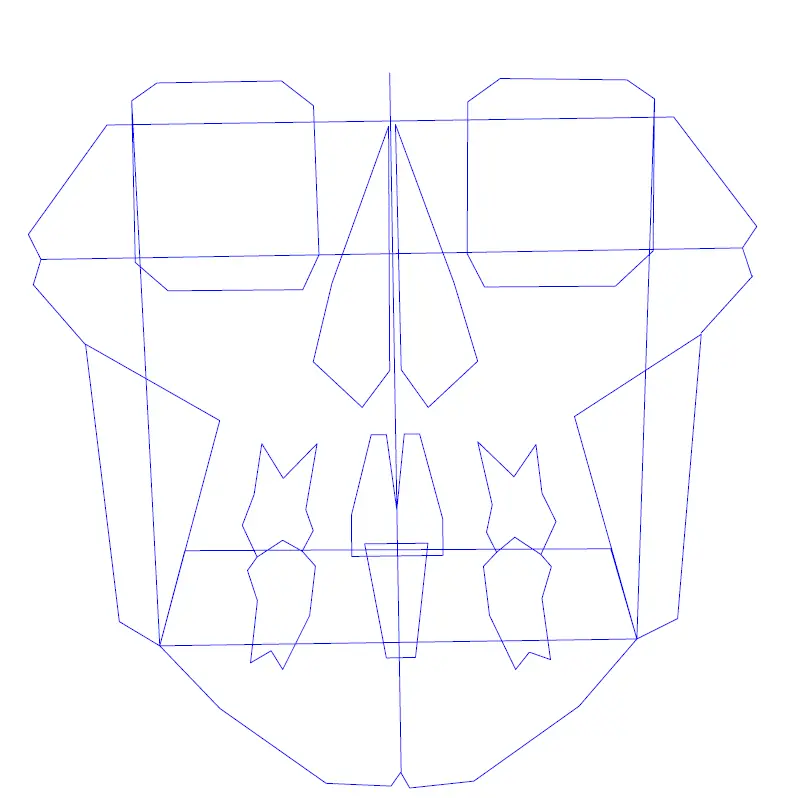
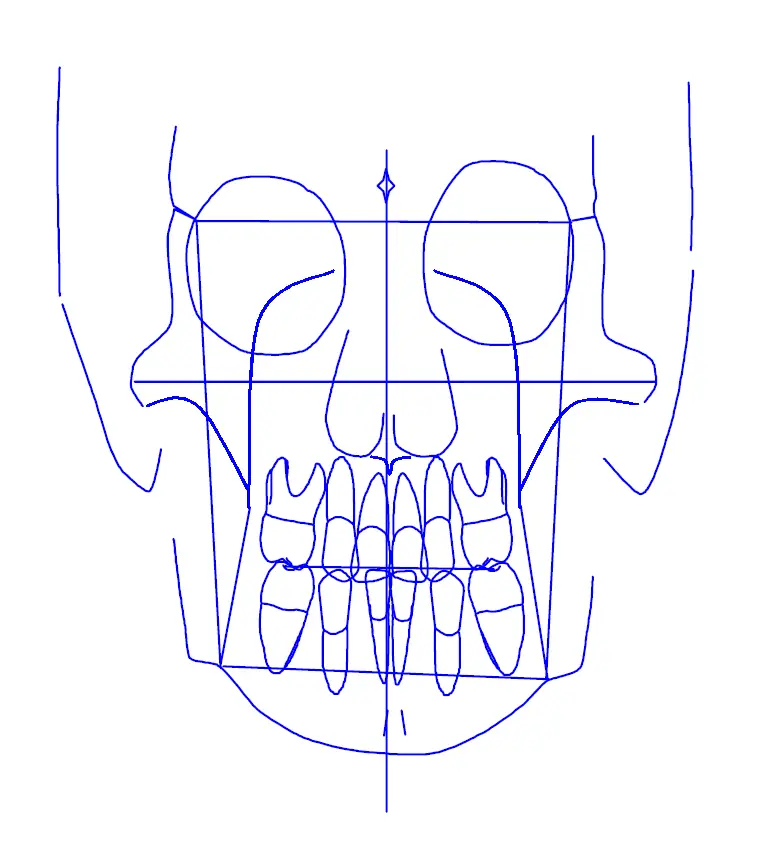
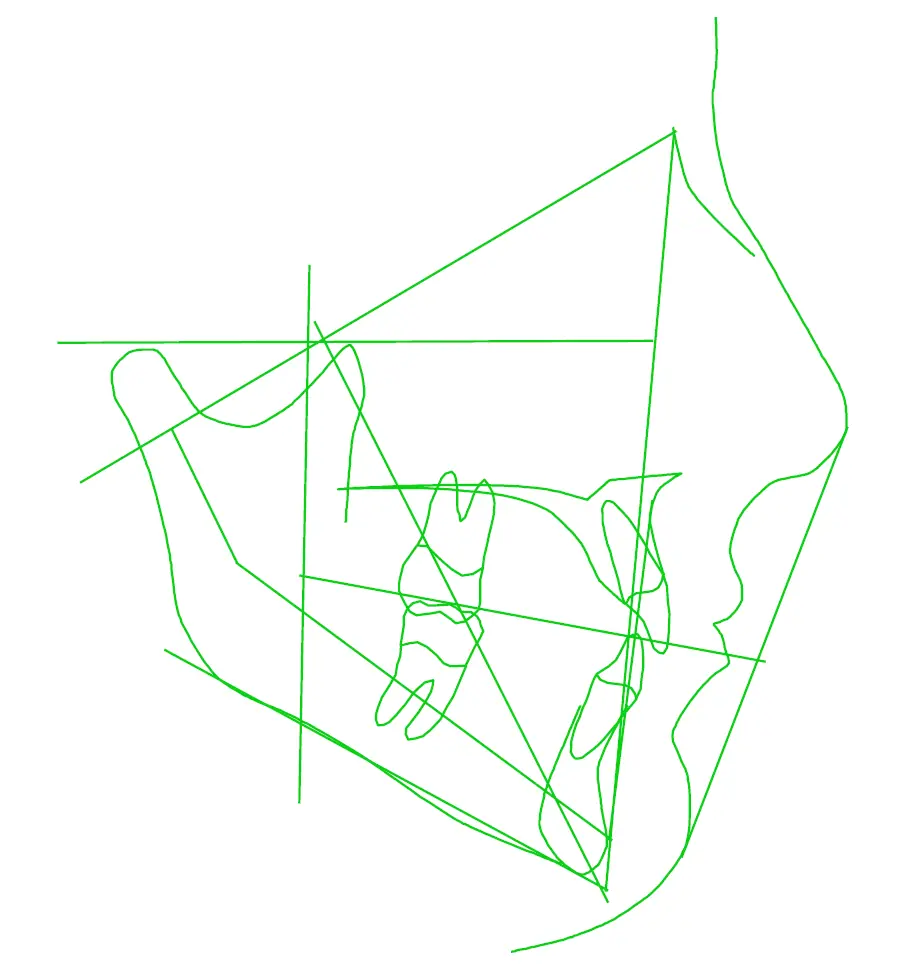
Lateral and frontal CEPHALOMETRIC tracings with the landmarks, lines, and planes that are utilized are shown. The definitions of the landmarks are presented in the pages immediately following this discussion. These points serve to evaluate the cranium, the mandible, the maxilla, the denture, and the soft tissue profile. In this and succeeding sections, the use of these landmarks in the analysis will be explained.
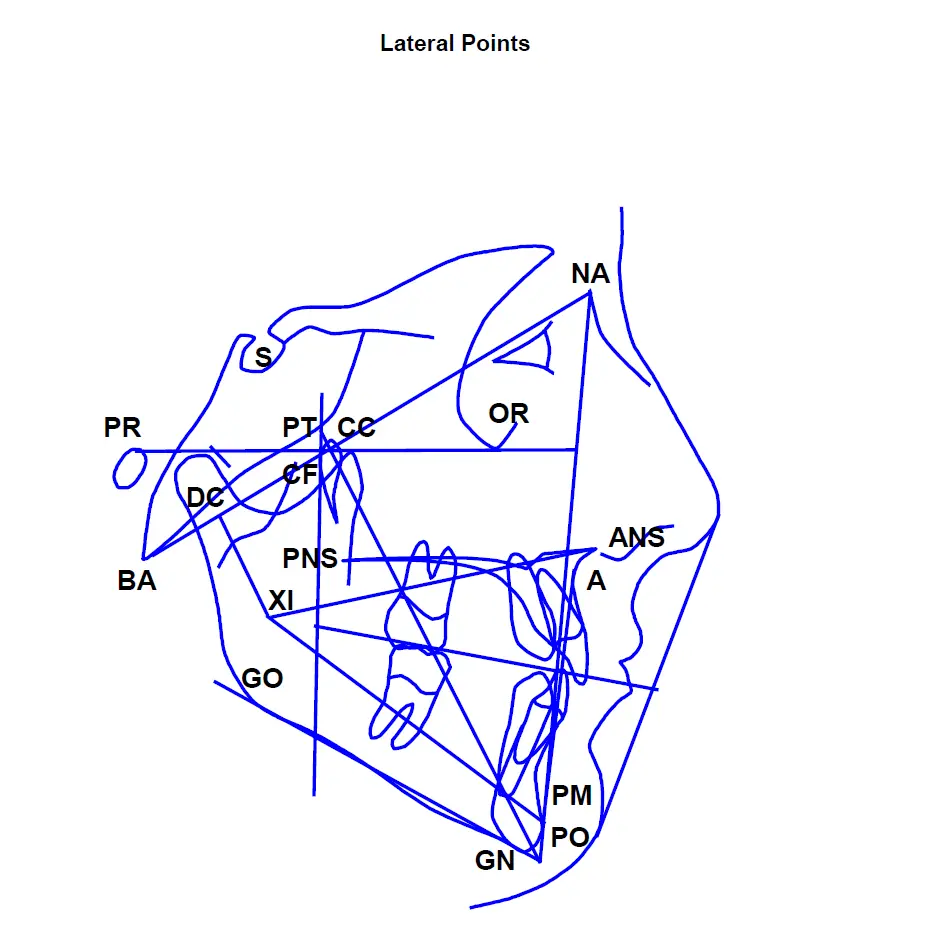
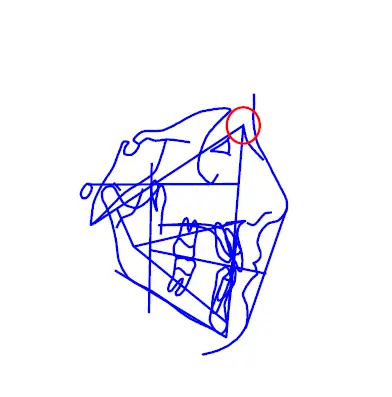
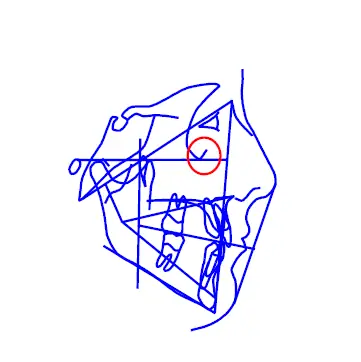
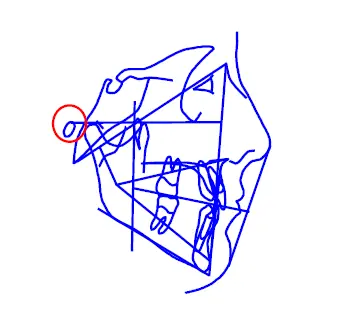
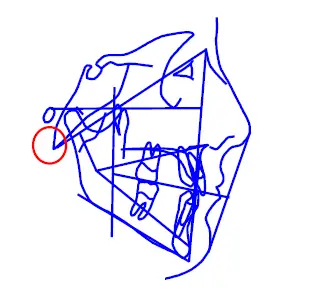
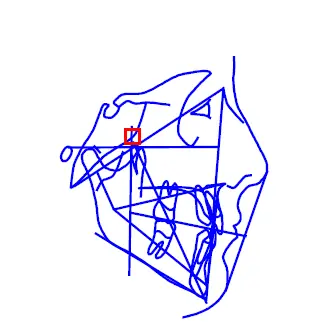
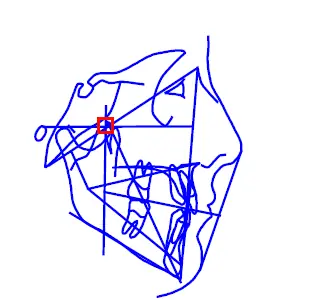
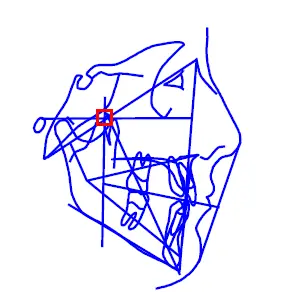
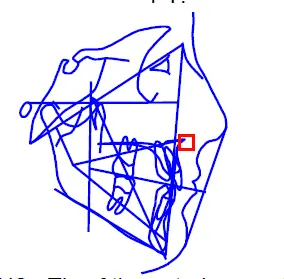
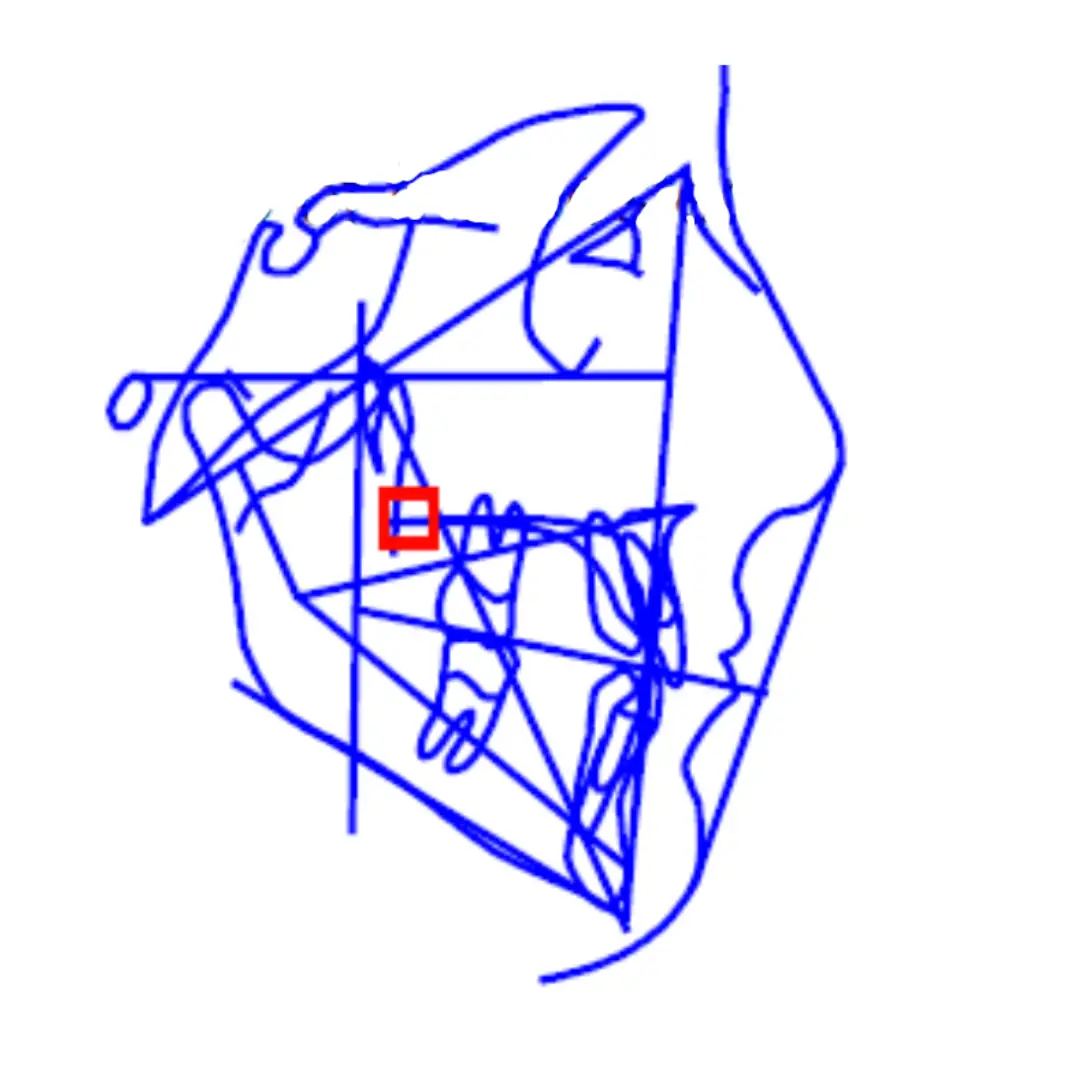
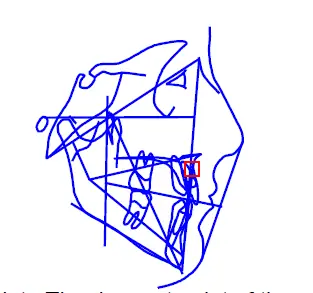
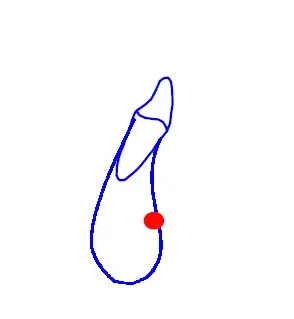
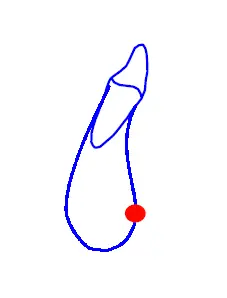
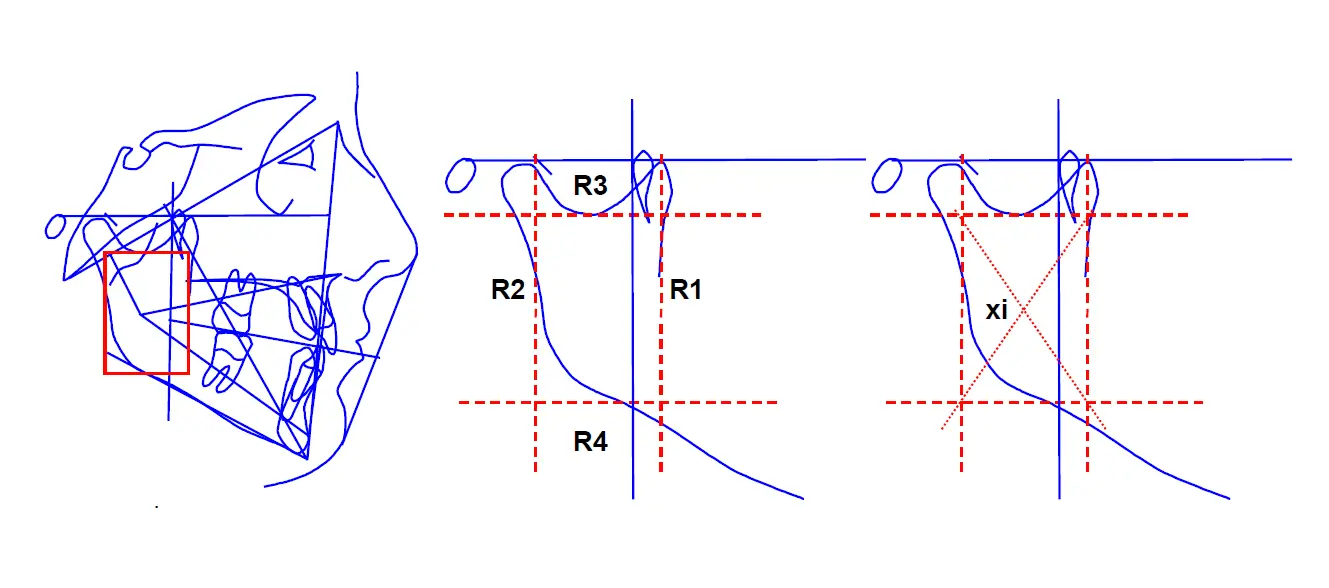
Xi-Point. A point located at the geographic center of the ramus. Location of Xi is keyed geometrically to PR-OR (FH) and perpendicular through PT (PTV) in the following steps:
1. By construction of planes perpendicular to FH and PTV.
2. These constructed planes are tangent to points (R1, R2, R3, R4) on the borders of the ramus.
3. The constructed planes form a rectangle enclosing the ramus.
4. Xi is located in the center of the rectangle at the intersection of diagonals.
R1-Mandible. The deepest point on the curve of the anterior border of the ramus, one-half the distance between the inferior and superior curves.
R2-Mandible. A point located on the posterior border of the ramus of the mandible.
R3-Mandible. A point located at the center and most inferior aspect of the sigmoid notch of the ramus of the mandible.
R4-Mandible. A point on the border of the mandible directly inferior to the center of the sigmoid notch of the ramus.
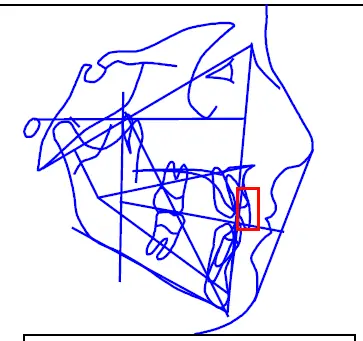
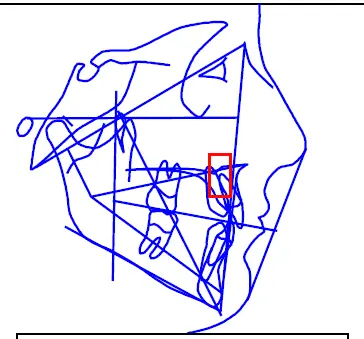
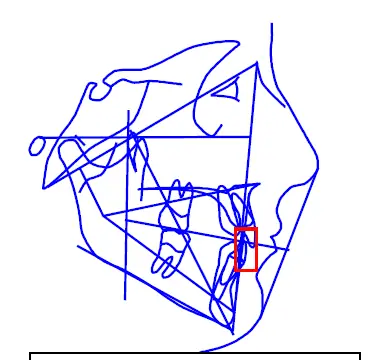
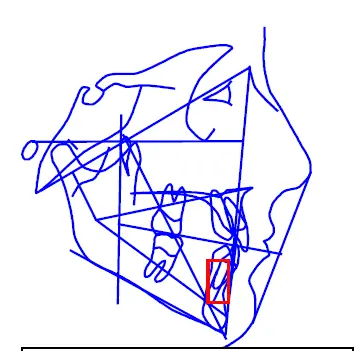
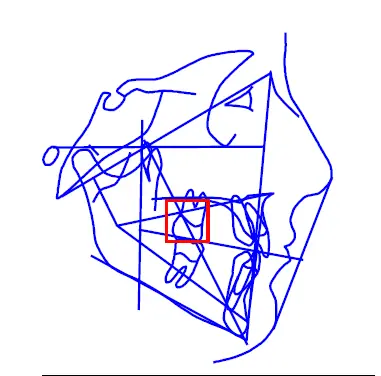
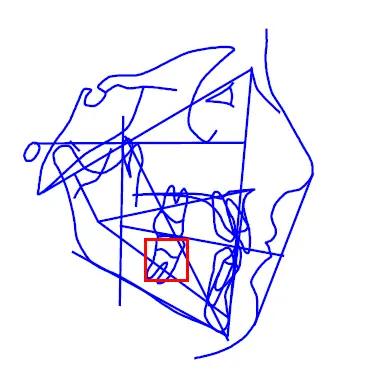
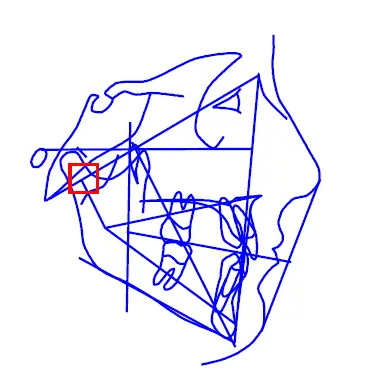
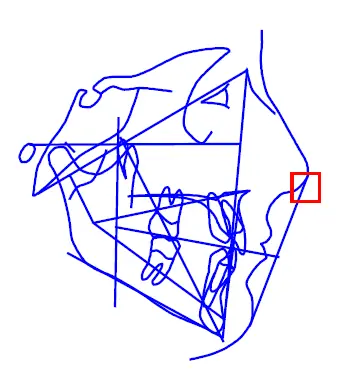
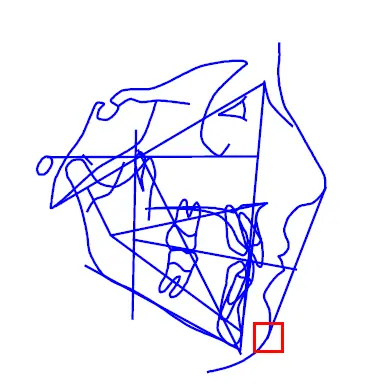
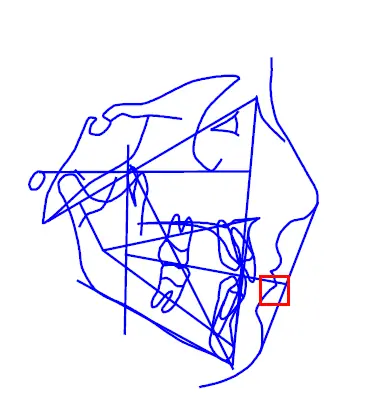
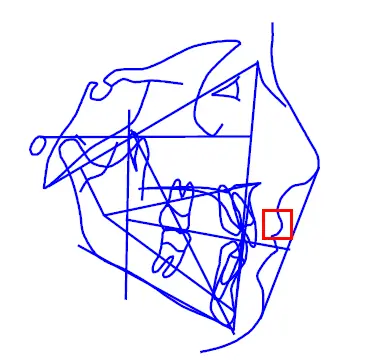
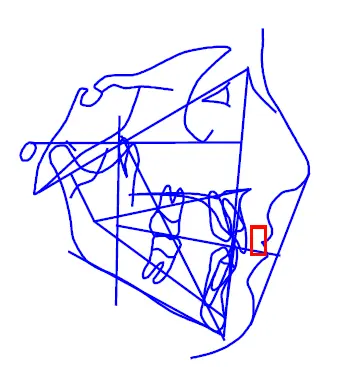
Each landmark defined earlier plays an important role in the formulation of the analysis. All of these points are used to define the angles, planes, and distances which describe the patient's cephalometric characteristics. The basic structure of the analysis is a series of planes constructed by connecting a number of the landmarks. These planes provide the basic framework for describing many possible craniofacial abnormalities.
One of the characteristics of the human head is the tendency of planes bordering on various segments of the skull to intersect at 30 degree, 40 degree, 60 degree, or 90 degree angles in the normal patient. Patient abnormalities are usually reflected in the amount of divergence form these angles. The analysis has incorporated these craniofacial characteristics. The following description of the construction of the basic planes of reference will more clearly explain this craniofacial phenomenon. In addition, several other planes will be defined which relate the skeleton to the dentition. Planes which aid in the description of the soft tissue profile will also be discussed.
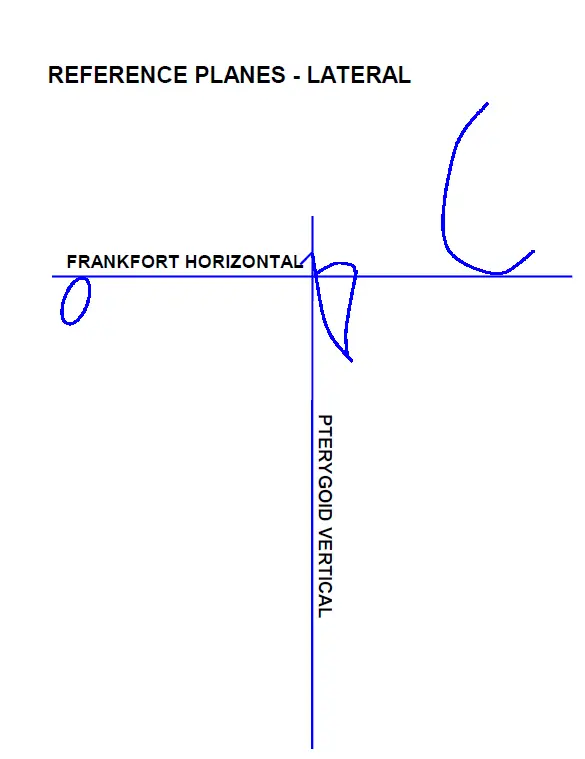
1. Basic reference. Porion and Orbitale relate to the basic sense organs—the eye and the ear. The plane connecting these two points forms the basic horizontal reference line in the lateral tracing head film known as the Frankfort Horizontal (FH). The basic vertical reference, the Pterygoid Vertical (PTV), may be constructed by drawing a line perpendicular to the Frankfort Plane at the posterior margin of the Pterygopalatine Fossa. The intersection of FH and PTV has been shown to be remarkably stable, i.e., the change in the location of this point as a result of patient growth is minimal. Therefore, serial cephalometric tracings of a patient can be superimposed at this point in order to obtain an overall view of patient growth.
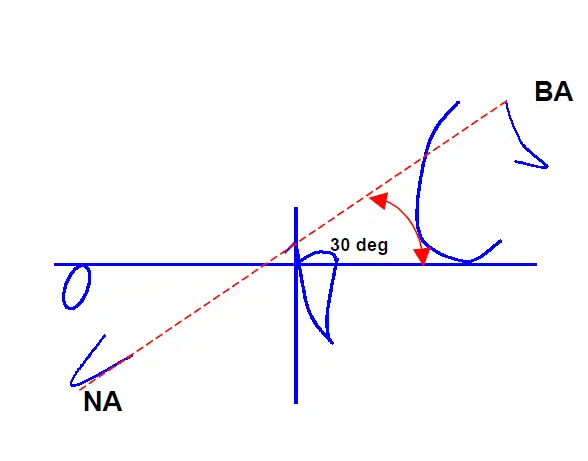
2. Cranial Base. The border between the face and the cranium can be defined by a line connecting Basion and Nasion. In the normal adult Caucasian, the Basion-Nasion Line makes a 30 degree angle with the Frankfort Plane.
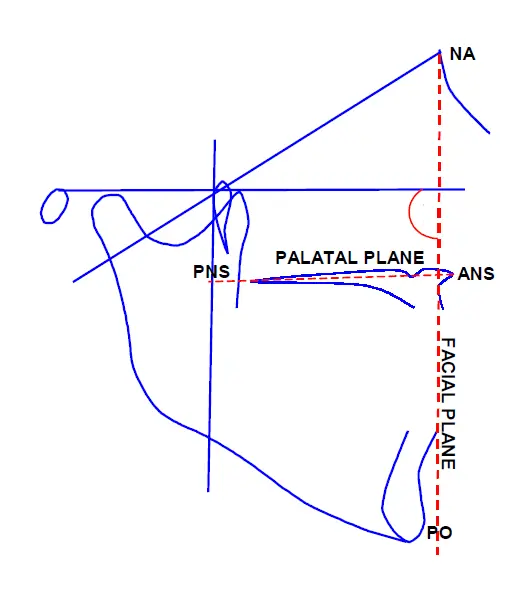
3. Maxilla. In the normal adult the Palatal Plane, defined by ANS-PNS, is parallel to the Frankfort Plane. In addition A-point, the anterior bony limit of the maxilla, falls on a perpendicular from Nasion through the Frankfort Plane called the Facial Plane.
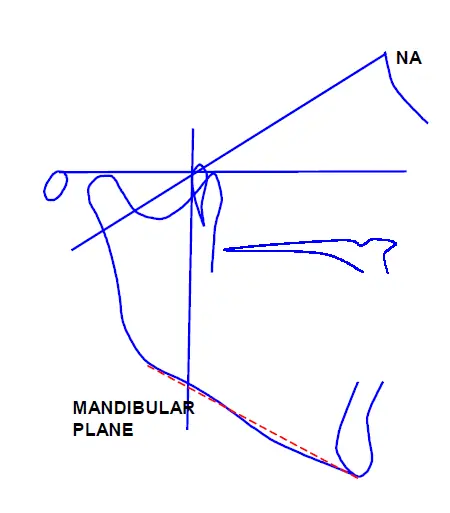
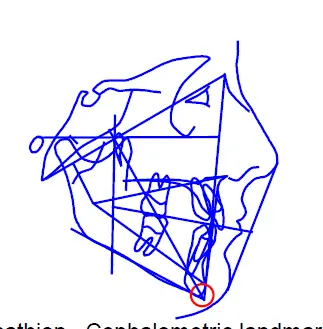
4. Mandible Pogonion defines the anterior position of the chin and falls on the Facial Plane. Therefore, the profile is neither convex nor concave since Nasion, the maxilla, and the mandible all fall on this line perpendicular to the Frankfort Plane. The Mandibular Plane is constructed as a tangent to the inferior border of the mandible. The point of intersection between the Facial Plane and the Mandibular Plane is cephalometric Gnathion.
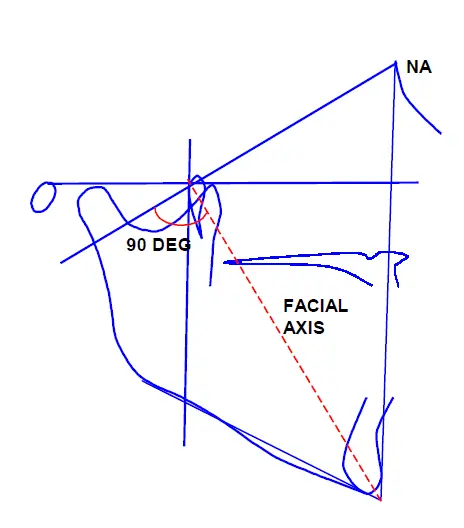
The Facial Axis is a line from PT Point through cephalometric Gnathion which normally intersects Basion-Nasion at a right angle.
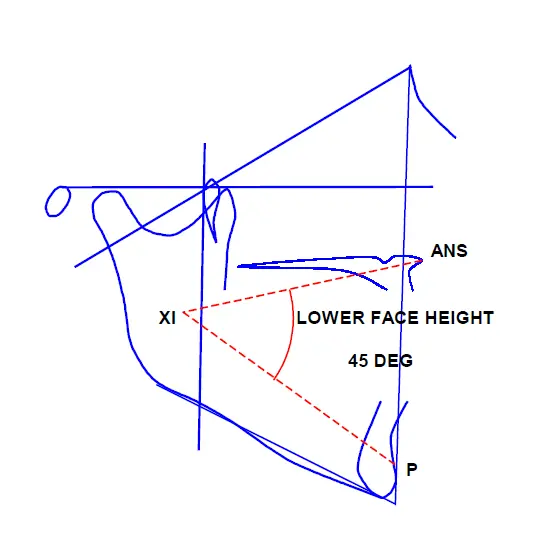
5. Maxillo Mandibular Relationship. Horizontally, the maxilla and mandible of the normal Caucasion adult profile are in perfect alignment, both falling along the Facial Plane. Vertically, the relation of the maxilla to the mandible is described by the Lower Facial Height, the intersection of two planes, ANS-Xi and Xi-PM. The norm for this measurement is 45 degrees.
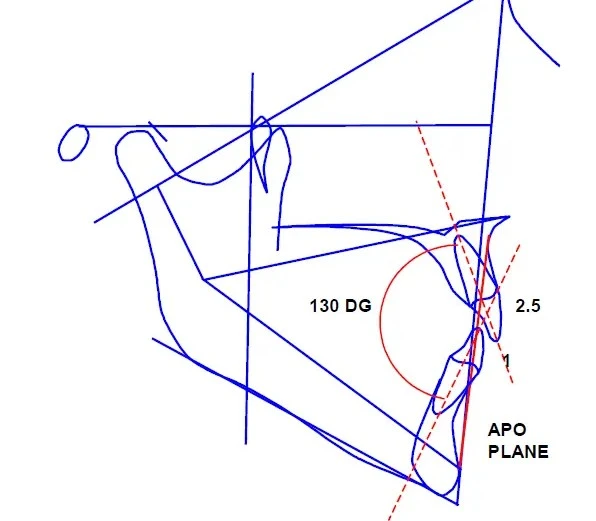
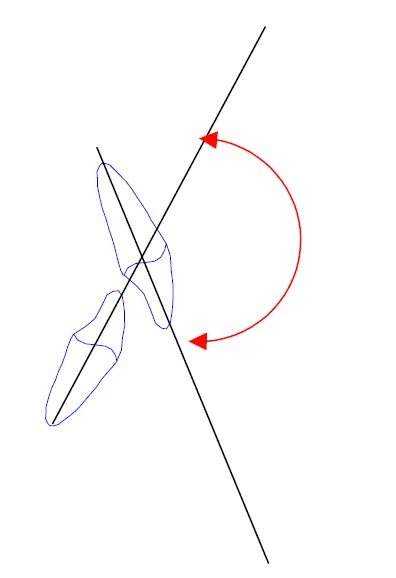
6. The Dentition. The A-Pogonion Plane defines a normal reference for the dentition. The mandibular incisor is 1 mm anterior to the A-PO Plane. The long axis of the maxillary incisor intersects the long axis of the mandibular incisor, at an angle of approximately 130 degrees, with a 2.5 mm horizontal (overjet) relationship and 2.5 mm vertical (overbite) relationship. The incisor overbite and overjet are the vertical and horizontal distances respectively between the tips of the upper and lower central incisors. These distances are measured relative to the Occlusal Plane.
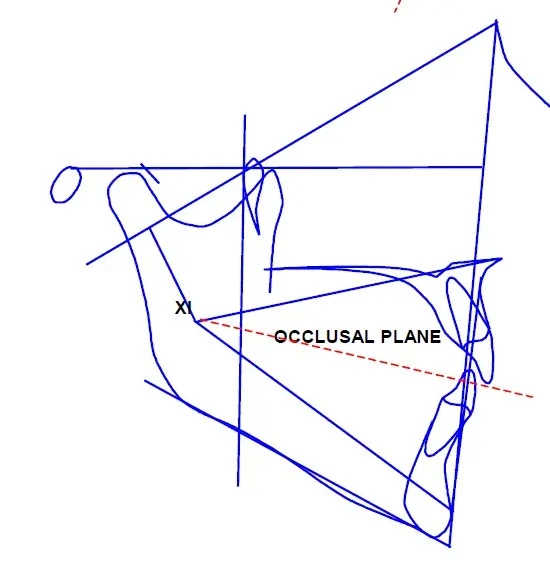
The Occlusal Plane is a line bisecting the overbite of the molars and passing through the overbite of the first bicuspids. In the adult Caucasian the plane passes just inferior to Xi-point, nearly bisecting the angle of Lower Facial Height. The Occlusal Plane is nearly parallel to the Frankfort Horizontal and Palatal Plane.
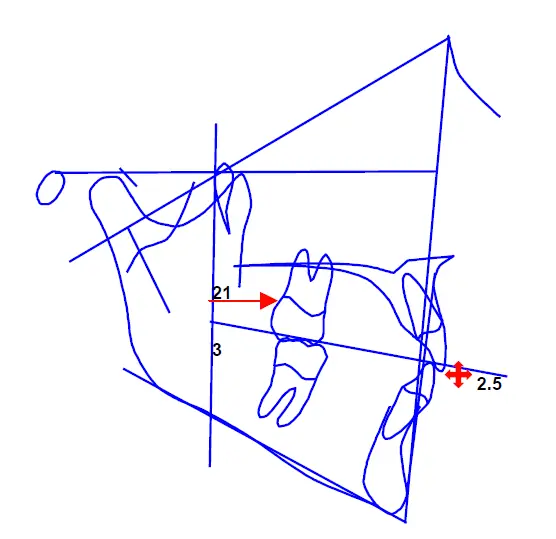
In a mature Caucasian male the maxillary first molar normally is 21 mm anterior to the Pterygoid Vertical. The relationship of the maxillary to the mandibular first molars is such that the maxillary molar is 3 mm distal to the mandibular molar.
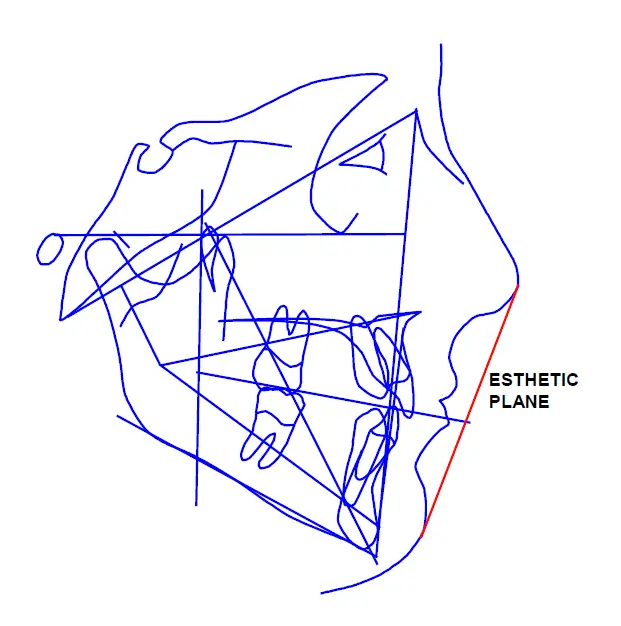
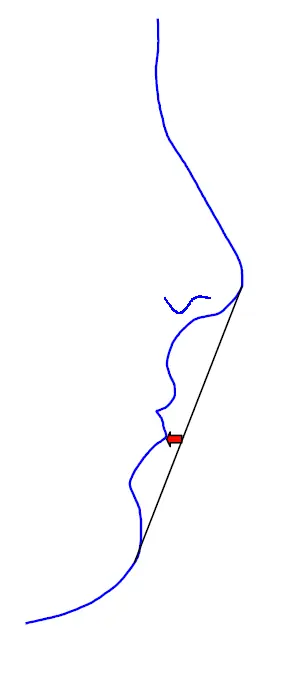
Soft Tissue Profile. A line connecting the tip of the nose and the most anterior point of the soft tissue chin is defined as the Esthetic Line. It is a basic reference line for evaluating facial balance. The lower lip in Caucasians should fall approximately 1 mm behind this Esthetic Line.
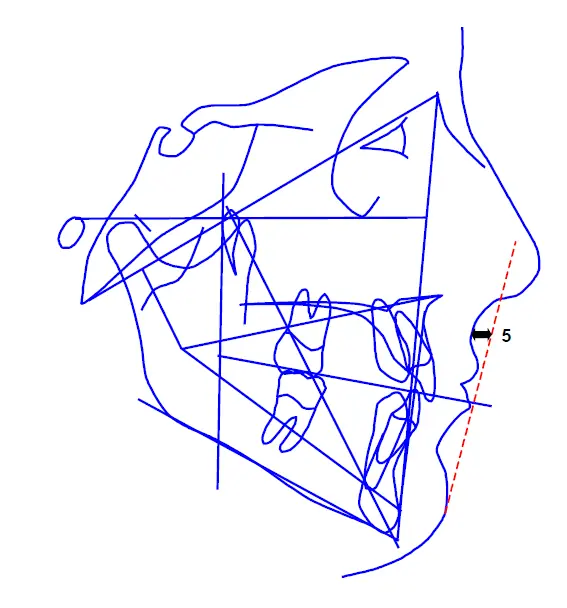
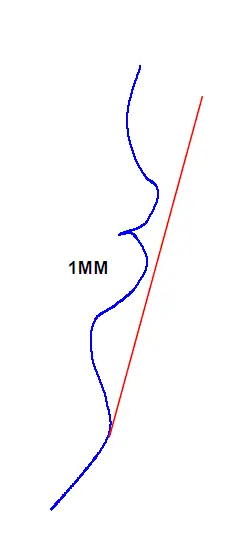
Another useful line is Holdaway's "Harmony Line". This line is drawn tangent to the soft tissue chin and the upper lip. Soft tissue A is 5 mm behind the Harmony Line; the lower lip falls approximately on the harmony line. The soft tissue is evenly distributed throughout the facial profile.
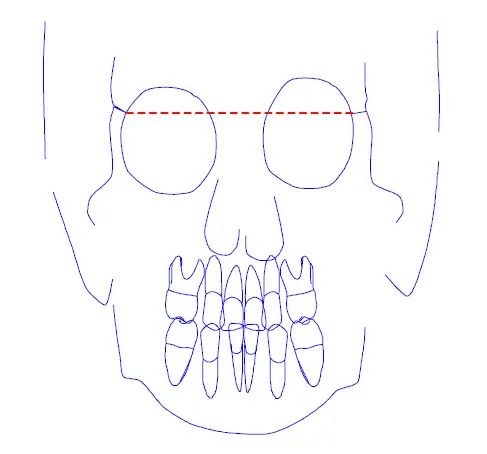
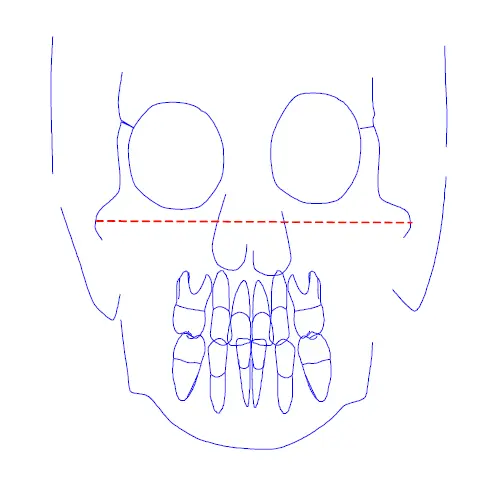
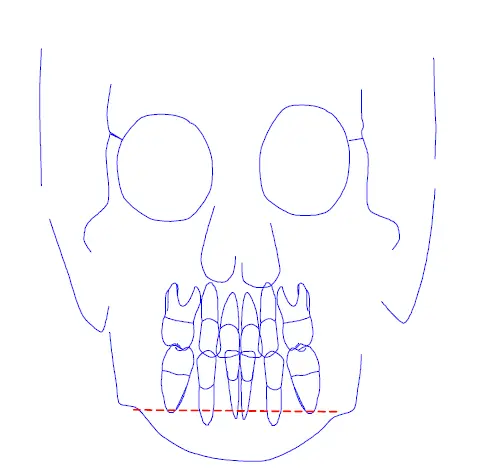
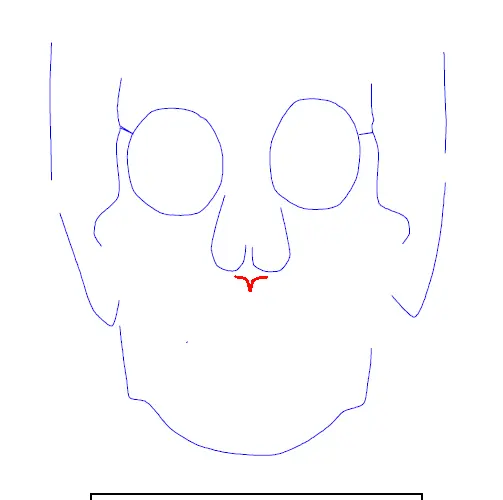
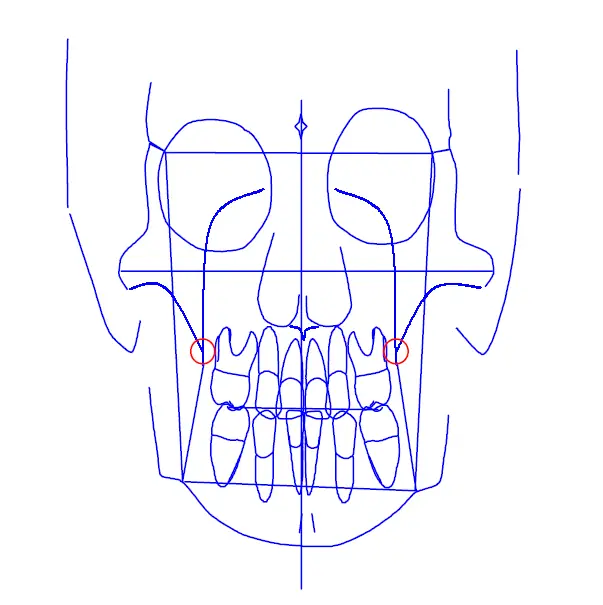
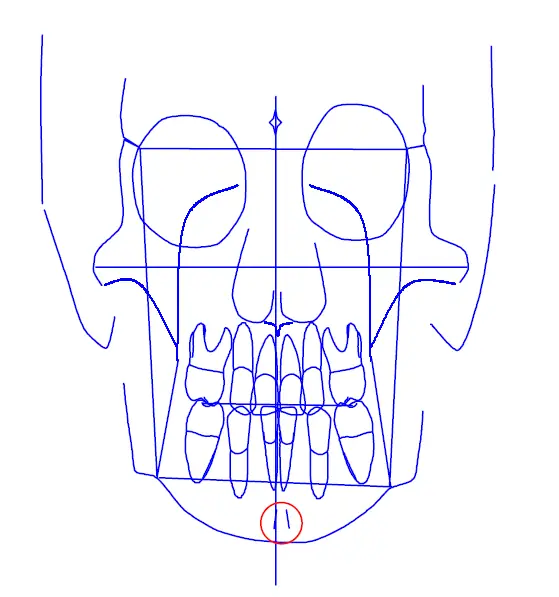
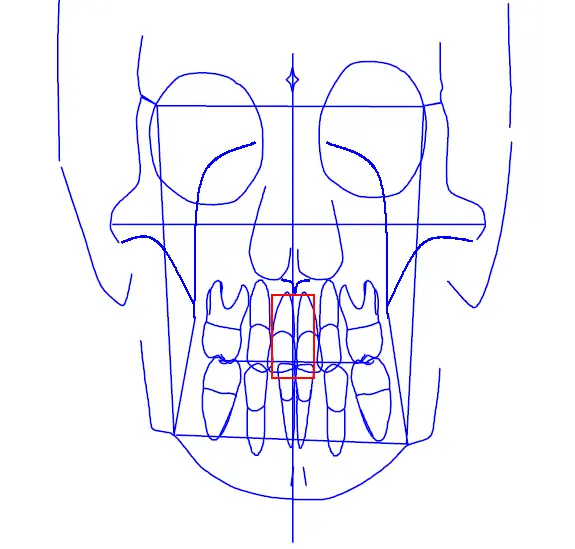
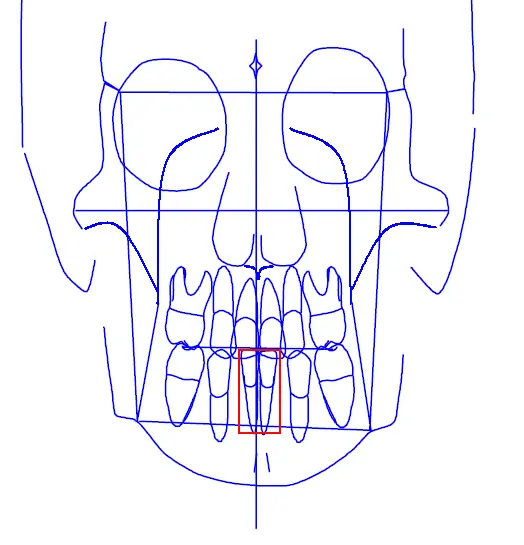
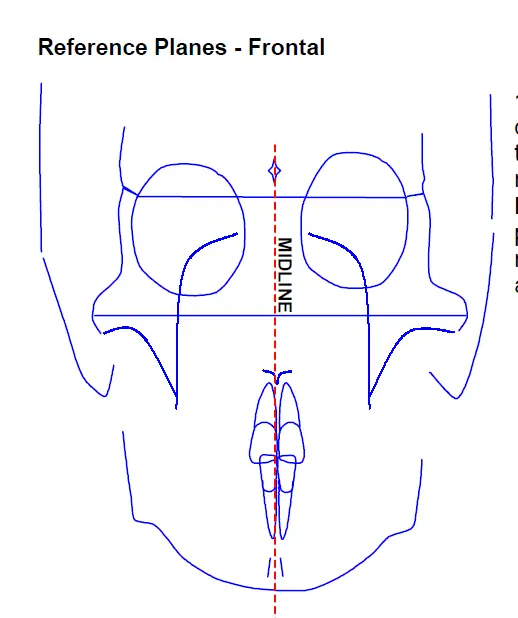
1. Basic Reference. The ZA-AZ Plane is drawn from the center of the left Zygomatic Arch to the center of the right, forming the horizontal reference line. A perpendicular to this plane, the Mid-Sagittal Plane, is drawn through the upper portion of the nasal cavity. This is the vertical reference line. These lines are used in describing asymmetry and mid-line deviations.
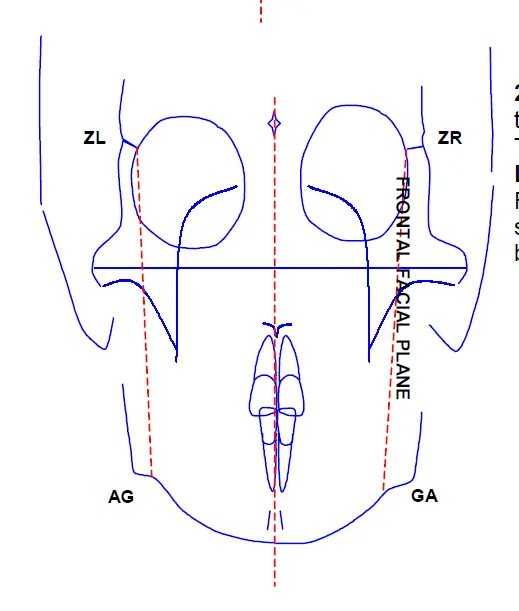
2. Denture Bases. Lines from the Z points to the AG points form the Frontal Facial Planes. The frontal denture plane is defined by the J-AG Line. The distance from J Point to the Frontal Facial Plane should be 15 mm (in an adult). This serves as a reference for location of the denture between the denture bases.
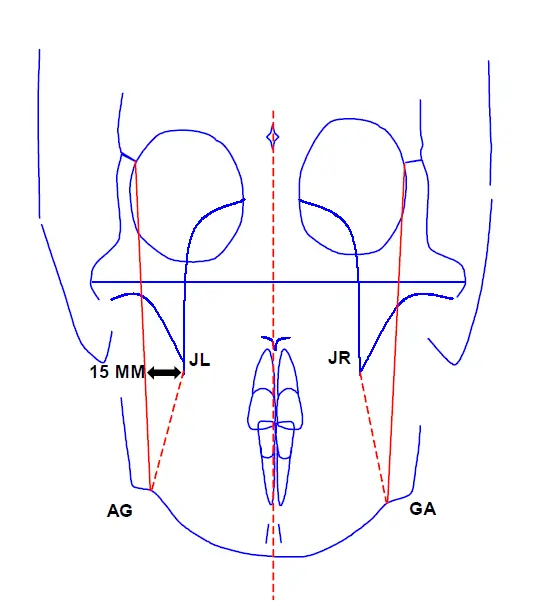
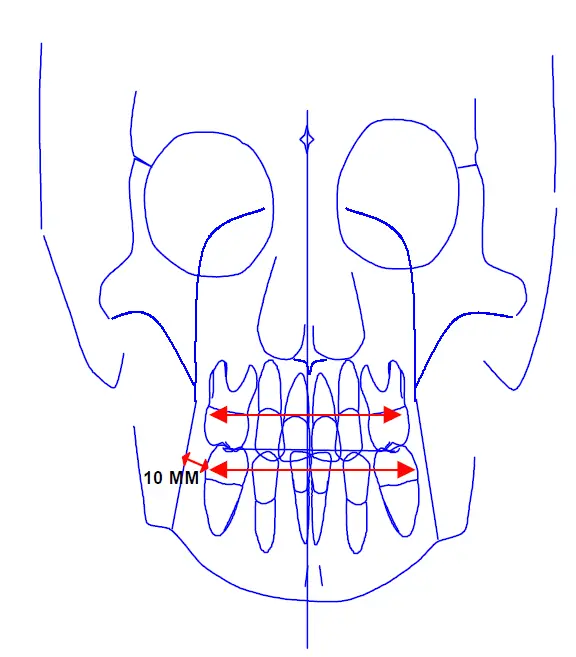
Denture. The Occlusal Plane defines the line of occlusion of the molars. The distance from the buccal margin of the mandibular first molar to the denture plane is 10 mm (in an adult). The distance between the buccal margins of the mandibular first molar.
Foundation for Modern Bioprogressive Orthodontics Diagnostic Services (FMBODS) in conjunction with the early investigations of Ricketts (TM), designed a computerized cephalometric analysis to quantify craniofacial characteristics in more detail. The result is a more scientific and accurate approach to cephalometrics as a diagnostic and treatment planning tool. Over the past two decades, more than 400,000 cases have been analyzed by the FMBODS computer. During this time, norms have been re-evaluated from time to time in order to reflect the large volume of information obtained from all cases analyzed. Whereas the basic analysis incorporates only 11 factors, the following analysis incorporates 70 cephalometric measurements. These values enable the computer to help analyze a case, predict future growth, and plan treatment objectives based on far more information than can be gleaned from the 11 factor analysis. In addition, the norms can be adjusted to age, size and racial characteristics to provide the proper framework for cephalometric interpretation. The lateral and frontal measurements included in the FMBODS computer analysis are listed below, along with norms and clinical deviations for Caucasian patients.
The following material is designed to serve as a source of reference for using the FMBODS Package. This manual covers the Comprehensive Cephalometric Description in detail and to a lesser degree the personal parameter file is covered. Please remember that as a service organization further information is just a phone call away.
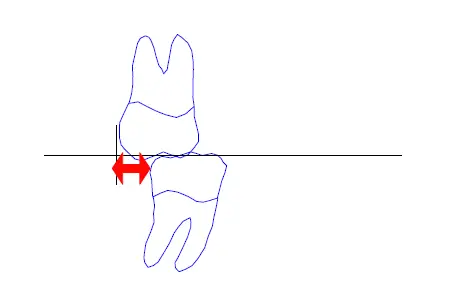
Describes Angle classification of occlusion
Measured from the distal surface of the lower molar to the distal surface of the upper molar along the Occlusal Plane.
Describes occlusion of the cuspids.
Measured from the tips of the upper and lower cuspids along the Occlusal Plane.
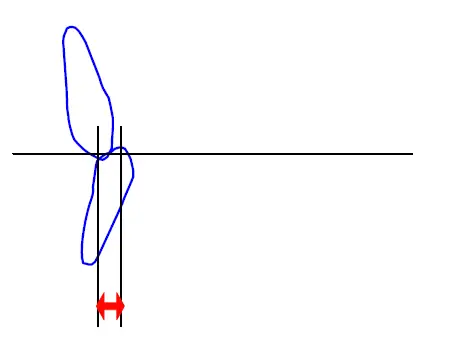
Describes horizontal occlusion of the anteriors.
Measured from the tip of the lower incisor to the tip of the upper incisor along the Occlusal Plane.
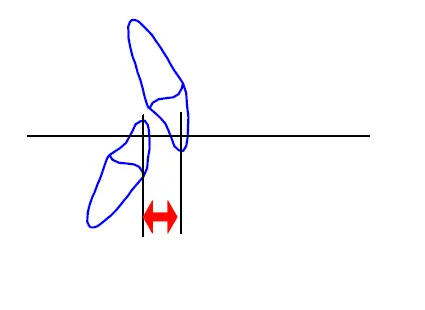
Describes the vertical dimension of dental occlusion.
Measured from the tips of the upper and lower incisors perpendicular to the Occlusal Plane.
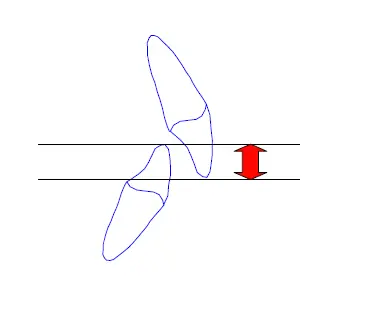
Used to describe the cause of an overbite.
Measured from the tip of the lower incisor to the Occlusal Plane.
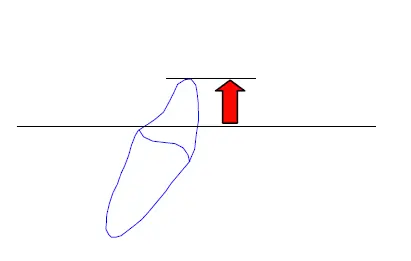
Describes both the vertical and horizontal dimensions of the occlusion of the incisors.
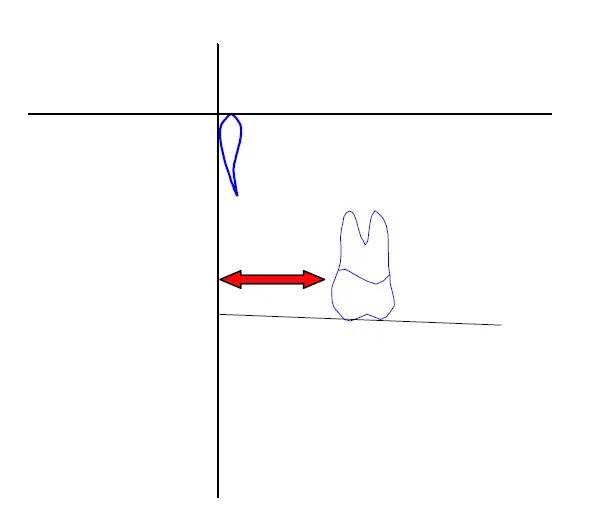
Describes the horizontal position of the upper first molar. Used to determine the cause or a posterior malocclusion.
Measured from the distal surface of the upper first molar to Pterygoid Vertical Plane.
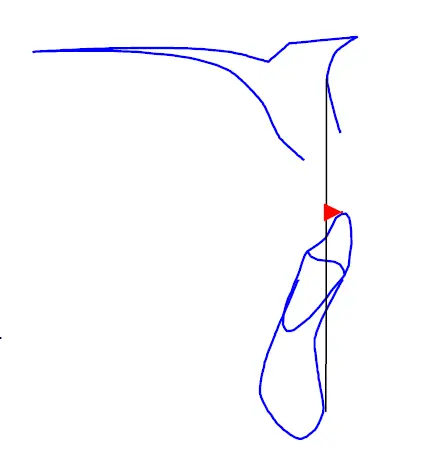
Describes the protrusion of the lower denture.
Measured from the tip of the lower incisor to a plane from hard tissue Point A to Pogonion.
Note: The norm listed for this measurement is considered ideal. This is more or less dependent on facial pattern, stability and personal preference of the clinician and patient.
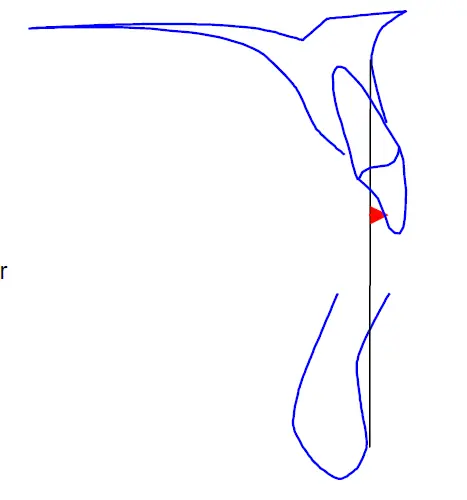
Describes the protrusion of the upper denture.
Measured from the tip of the upper incisor to a plane from hard tissue Point a to Pogonion.
Note: the norm listed for this measurement is considered ideal. The final position of the upper incisor should be dependent on the final position of the lower incisor (i.e., incisor overbite, overjet and interincisal angle.)
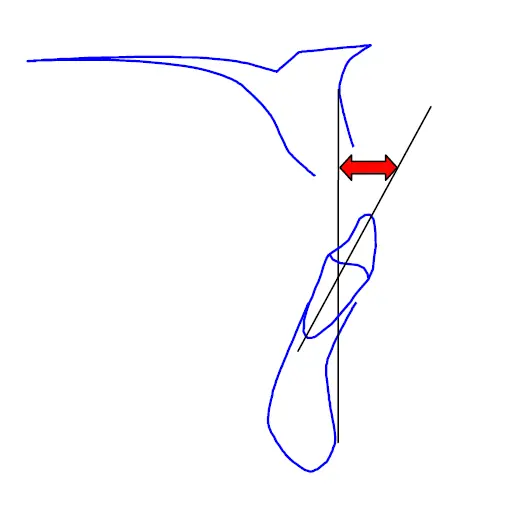
Describes the position of the lower incisor relative to the mandible and maxilla.
Measured by the angle formed by the long axis of the lower incisor to a plane from hard tissue A point to Pogonion.
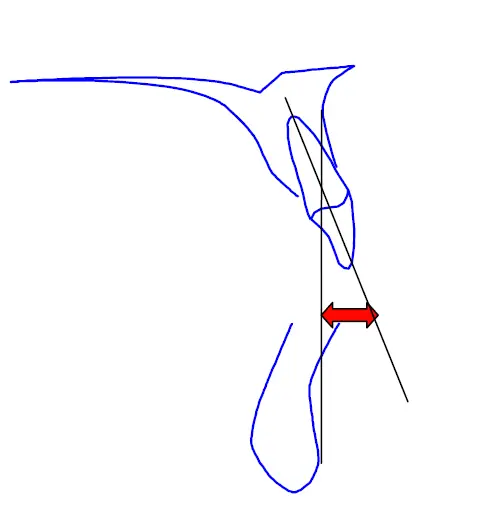
Describes the position of the upper incisor relative to the mandible and maxilla.
Measured by the angle formed by the long axis of the upper incisor to a plane from hard tissue Point A to Pogonion.
Describes the inclination of the Occlusal Plane in relation to the mandible.
Measured by the distance of the Occlusal Plane to the geographic center of the ramus.
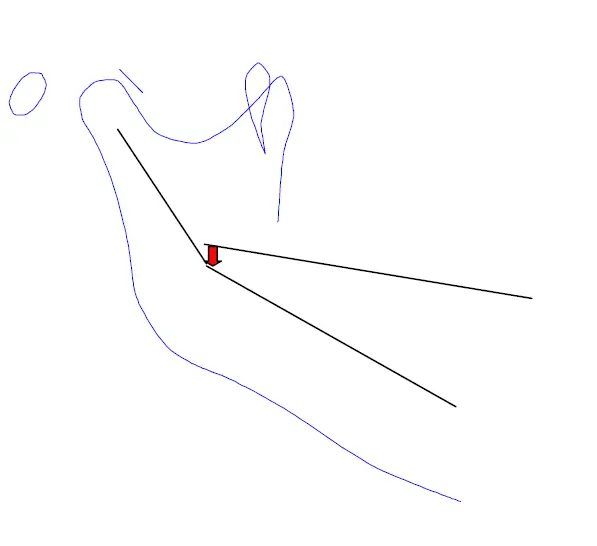
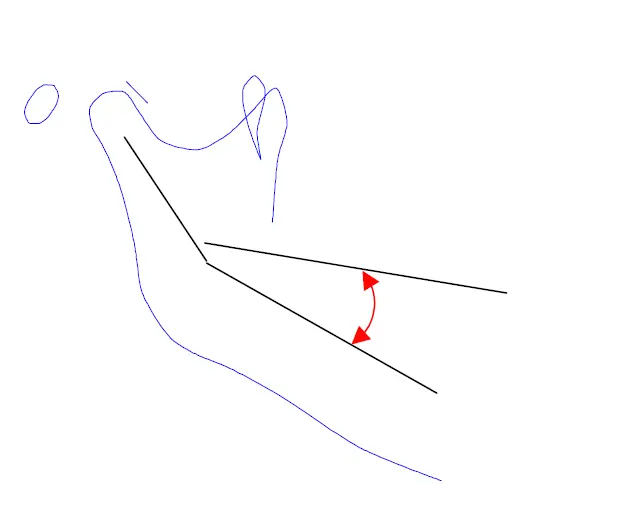
Describes the inclination of the Occlusal Plane with relation to the mandible.
Measured by the angle formed by the Occlusal Plane and Corpus Axis.
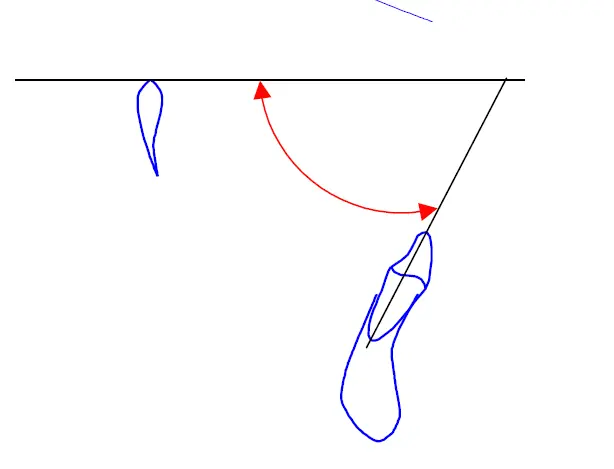
Describes the inclination of the lower incisor with relation to a horizontal reference point.
Measured by the angle formed from the long axis to the lower incisor to Frankfort Horizontal plane.
Describes lip protrusion.
Measured from the most anterior point on the lower lip to plane form the tip of the nose to the most anterior point on the chin.
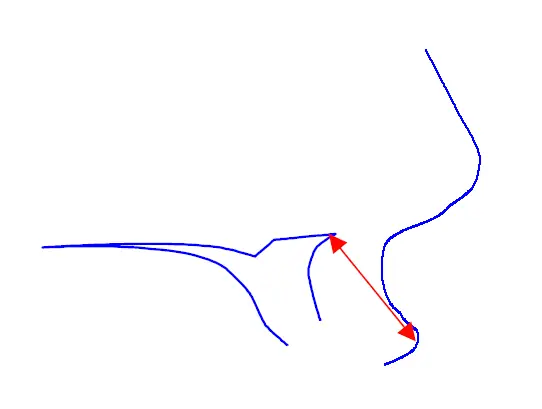
Can be used to determine the cause of lip strain.
Measured from anterior nasal spine to the vermilion border of the upper lip.
Note: This measurement should be ignored if the lips are open on the cephalometric tracing.
Used to appraise soft tissue. High values may indicate a gummy smile.
Measured from lip embrasure to the Occlusal Plane.
Norm-3.0 mm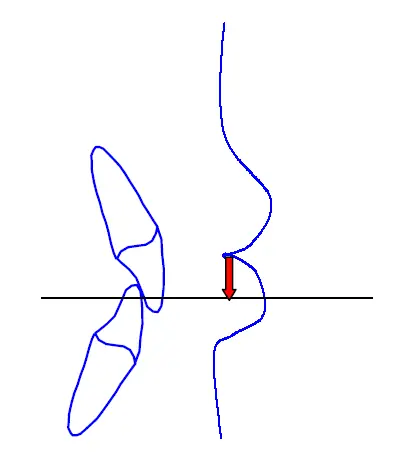
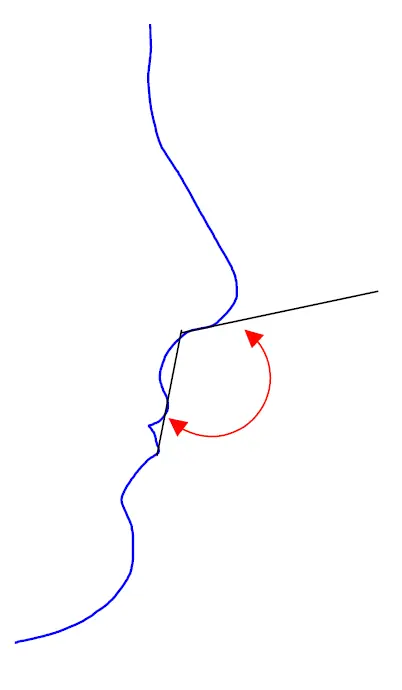
Used to appraise soft tissue.
Measured by the angle formed by a plane from the vermilion border of the upper lip to subnasale and a plane from subnasale to a tangent point on the inferior border of the nose.
Used to describe the cranial base.
Measured by the angle formed by the planes Nasion - Sella - Basion.
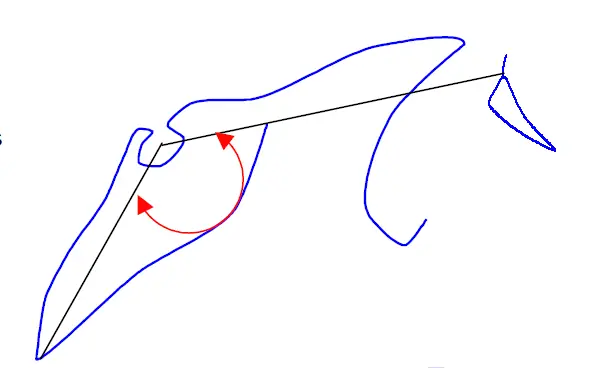
Can be used to determine the horizontal position of the hard and soft palate which is useful for determining the cause of an airway obstruction.
Measured by the angle formed by the planes Basion - Sella and Sella - Posterior Nasal Spine.
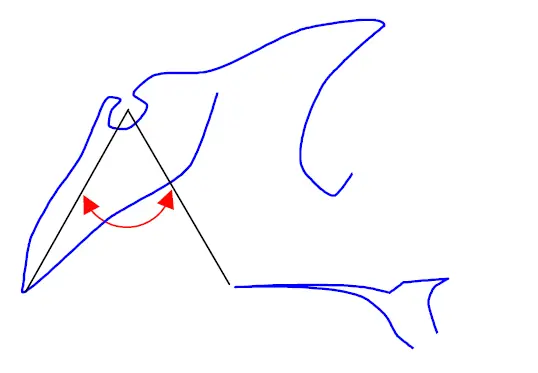
Determines percentage of nasopharynx occupied by adenoid tissue.
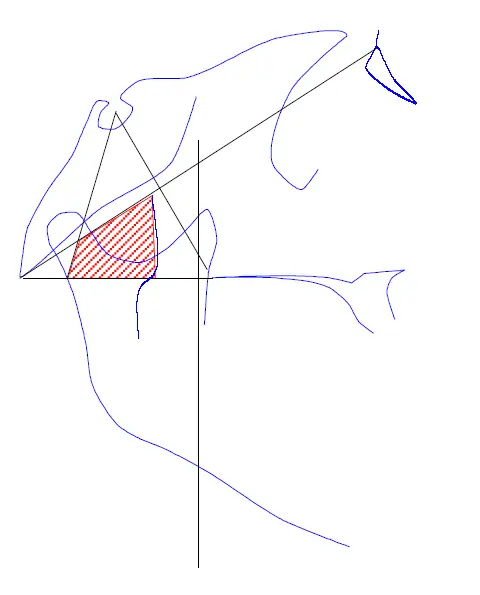
Used to determine the cause of airway obstruction.
Measured by the distance from PNS to the nearest adenoid tissue in a line from PNS to Basion.
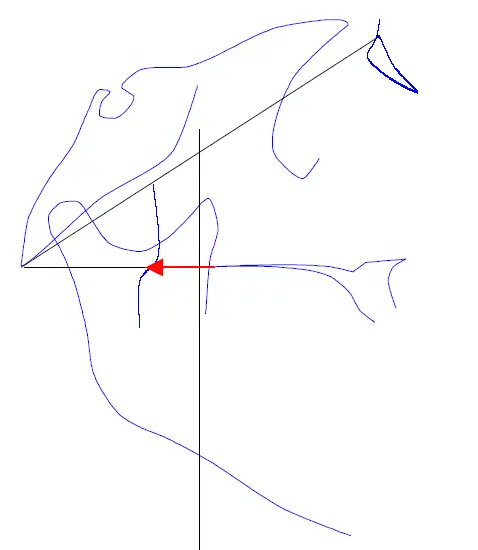
Used to determine the cause of airway obstruction.
Measured by the distance from PNS to the nearest adenoid tissue in a line from PNS perpendicular to Sella-Basion.
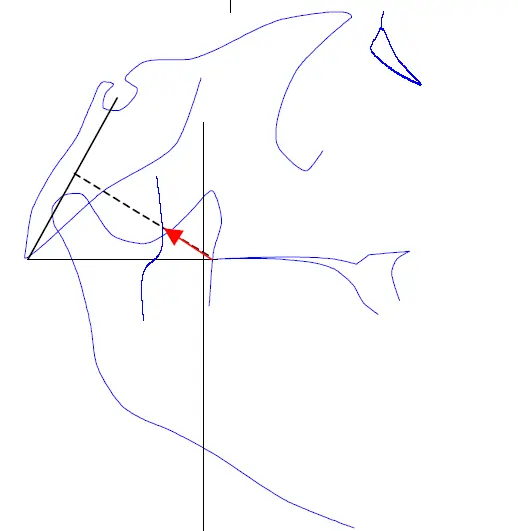
Used to determine the cause of airway obstruction.
Measured from a point on PTV 5 mm superior to PNS to the nearest adenoid tissue.
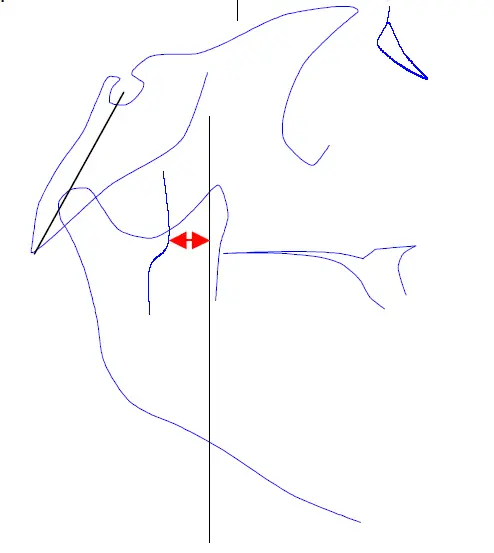
Describes the horizontal relation of the maxilla to the mandible.
Measured from hard tissue Point A a plane from Nasion to Pogonion.
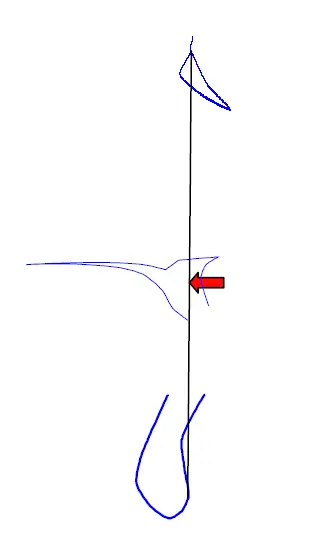
Describes the vertical relation of the mandible and maxilla.
Low values indicate a skeletal deep bite.
Measured by the angle formed by the planes Xi - ANS and Xi - PM.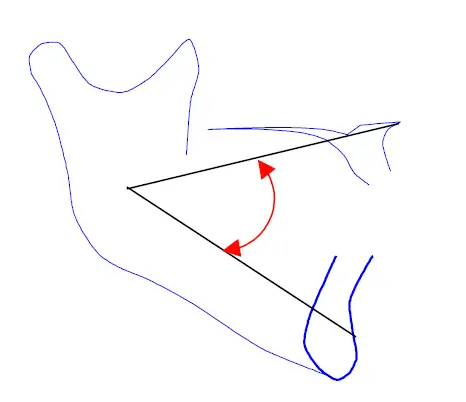
Patient's present height in inches.
Describes the vertical dimension of the ramus with relation to the cranium.
Measured from Sella to constructed Gonion.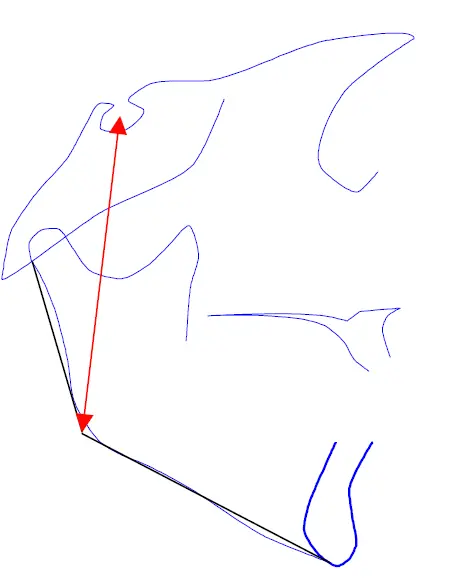
Describes the vertical dimension of the symphysis with relation to the cranium.
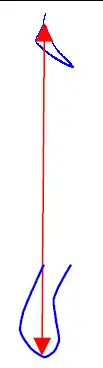
The ratio of anterior face height to posterior face height (NA to ME). It is suggested that a norm is about 60-62. The higher the ratio the more brachycephalic the face where a low ratio would indicate a more dolicho facial pattern.
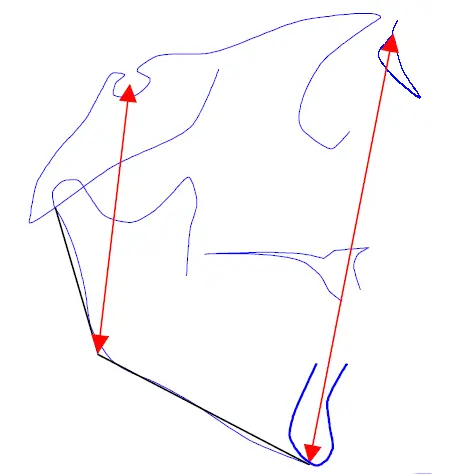
Determines the horizontal position of the glenoid fossa. Low values could indicate more than average forward growth of the mandible.
Measured by the angle formed by the planes Nasion - Sella and Sella - Articulare.
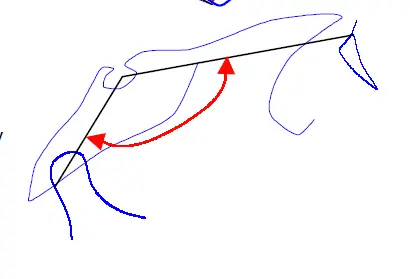
Can be used to evaluate a horizontal skeletal imbalance.
Measured by the difference in length of the planes Condylion - Point A and Condylion - Gnathion.
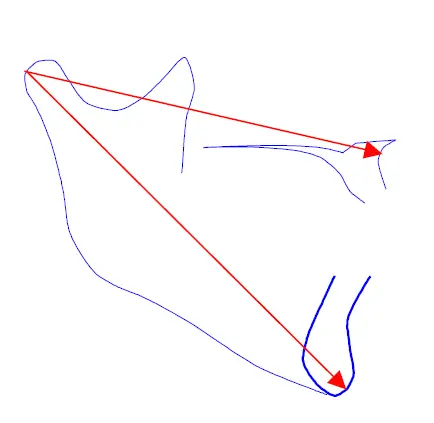
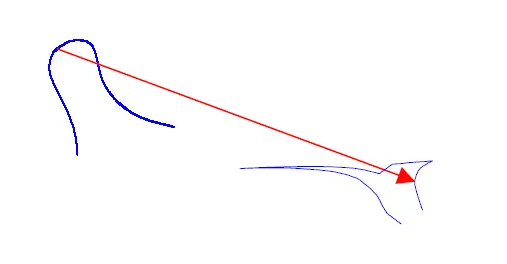
Determines the effective mid-facial length.
Measured from point Condylion to Point A.
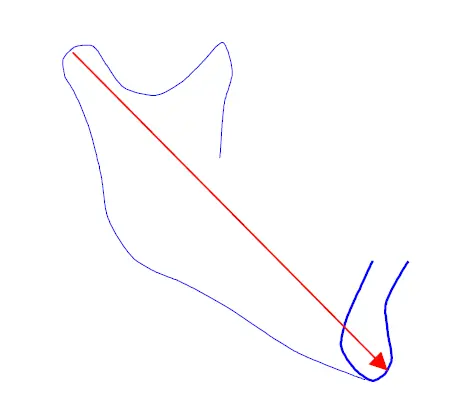
Determines the effective mandibular length.
Measured from point Condylion to Gn.
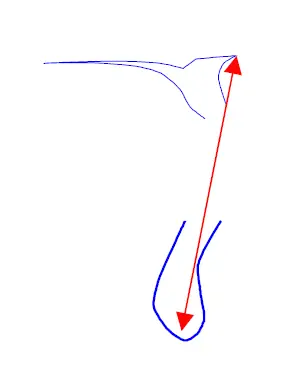
Determines the lower anterior face height.
Measured from Menton to Anterior Nasal Spine.
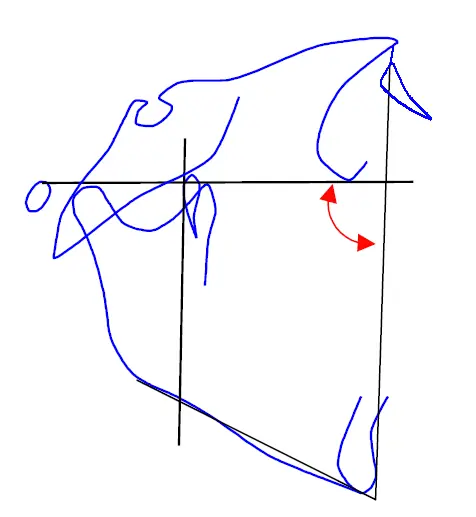
Determines the horizontal relation of the mandible to the cranium..
Measured by the angle formed by the planes Nasion - Pogonion and Frankfort Horizontal.
Can be used to determine the direction of growth of the chin.
Measured by the angle formed by the plane CC to Gnathion and the Basion - Nasion Plane.
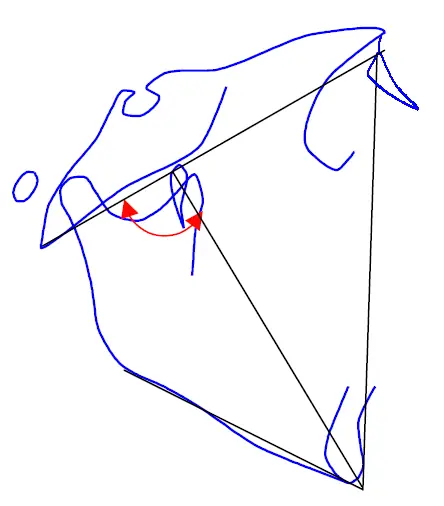
Determines the horizontal relation of the maxilla with relation to the cranium.
Measured by the angle formed by the plane Nasion - Point A and the Frankfort Horizontal Plane.
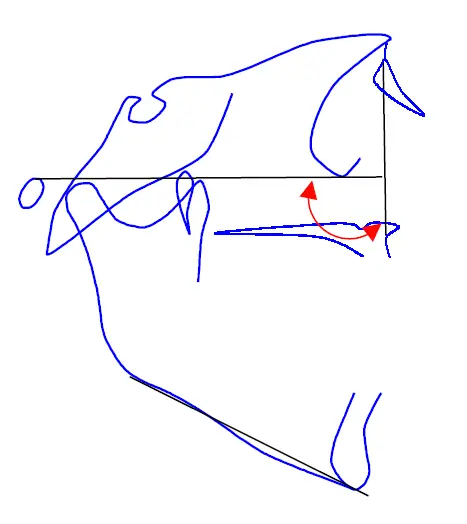
Describes the vertical relation of the maxilla to the cranium.
Measured by the angel formed by the planes CF -Point A and CR - Nasion..
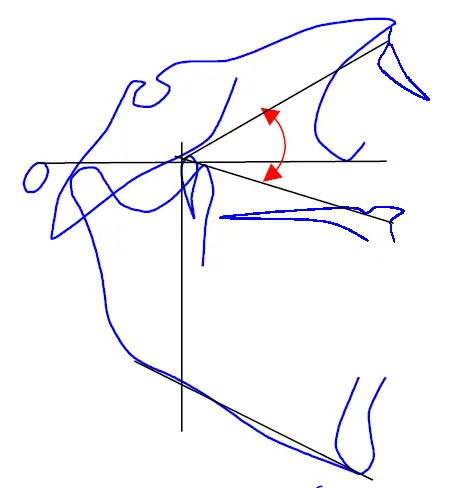
Describes the inclination of the maxilla with relation to the cranium.
Measured by the angle formed by the Palatal Plane to Frankfort Horizontal.
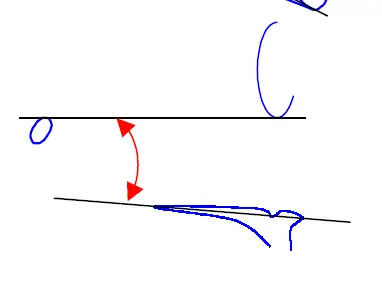
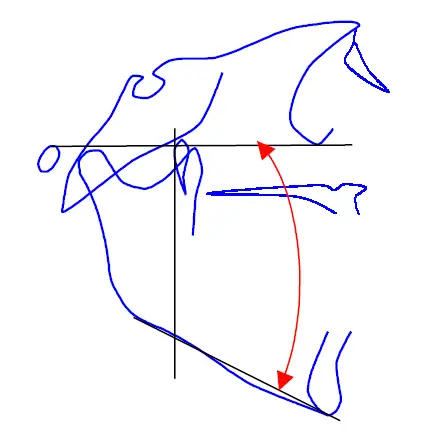
Describes the shape of the mandible.
Measured by the angle formed by Mandibular Plane to Frankfort Horizontal.
Describes the horizontal position of the maxilla to the cranium.
Measured by the angle formed by the planes Basion - Nasion and Nasion - Point A
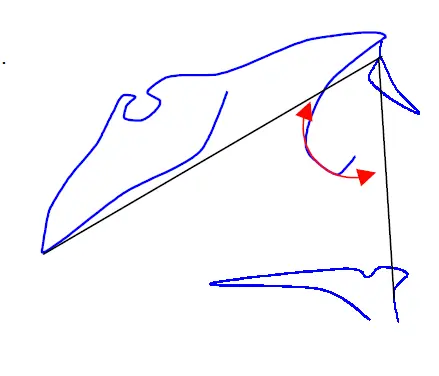
Describes the horizontal position of the mandible to the cranium.
Measured by the angle formed by the Planes Sella - Nasion and Nasion - Point B.
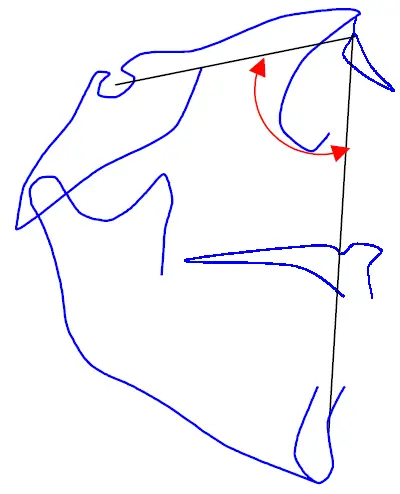
Describes the horizontal position of the maxilla to the cranium.
Measured by the angle formed by the planes Sella - Nasion and Nasion - Point A.
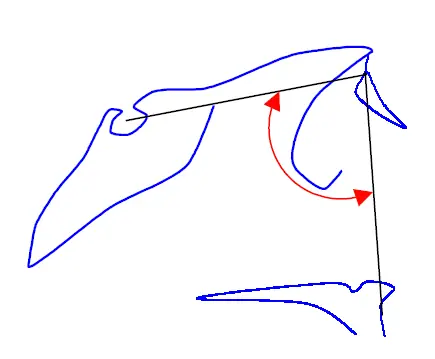
Can be used to describe a horizontal skeletal imbalance of the mandible and maxilla.
Measured by the angle formed by the planes Nasion - Point A - Point B.
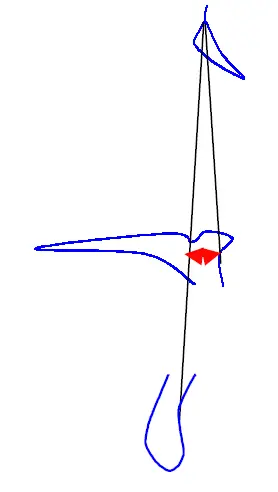
High values may indicate abnormal mandibular growth.
Measured by the angle formed by the planes Basion to Nasion and Frankfort Horizontal.
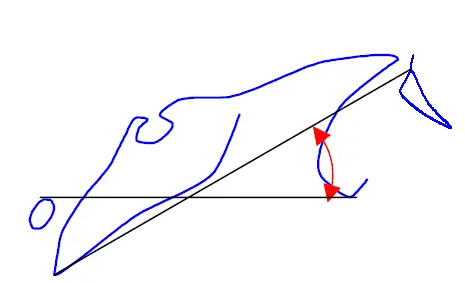
Describes the length of the anterior cranial base.
Measured from CC point to Nasion along the Basion - Nasion Plane.
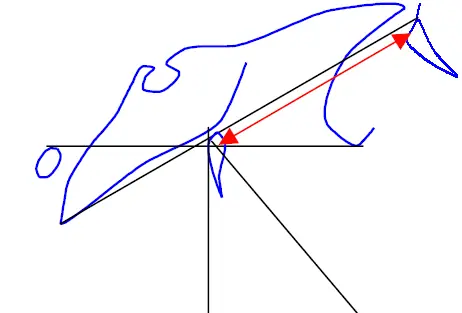
Describes the shape of the mandible. Low values may indicate a more vertical facial pattern and possible future TMJ problems.
Measured from point CF to constructed Gonion.
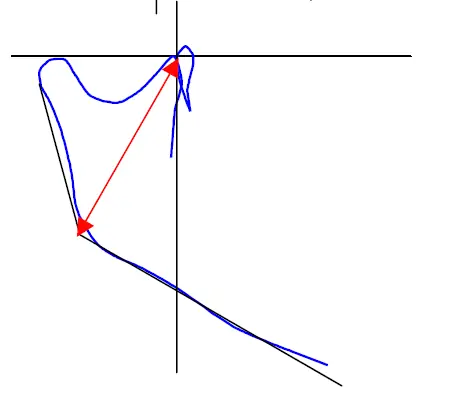
Describes the horizontal position of the ramus. High values may indicate abnormal mandibular growth.
Measured by the angle formed by the planes CF - Xi and Frankfort Horizontal.
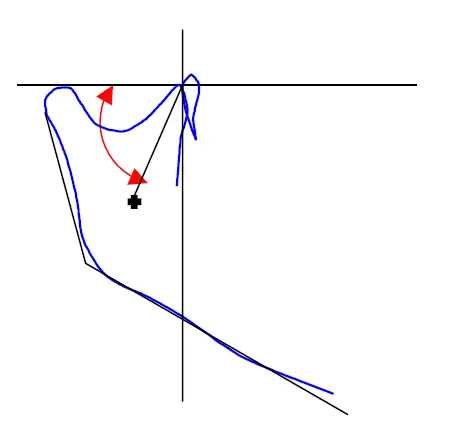
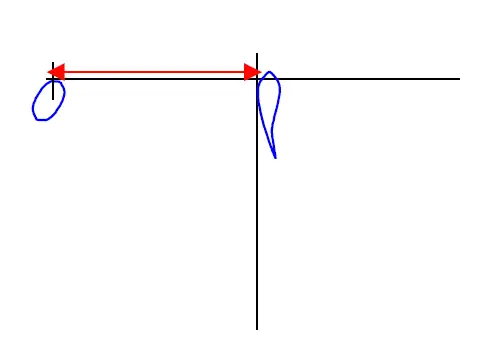
Describes the horizontal position of Porion and the Glenoid Fossa. Low values may indicate abnormal mandibular growth.
Measured by the distance from Porion to PTV along the Frankfort Horizontal Plane.
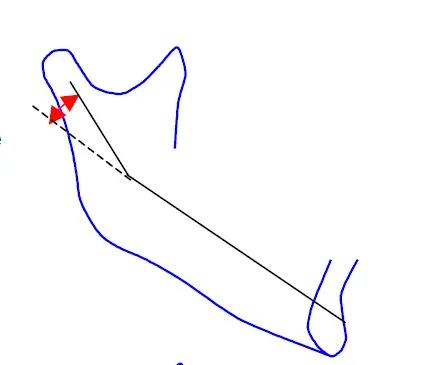
Describes the shape of the mandible.
Measured by the angle formed by the Corpus and Condyle Axes.
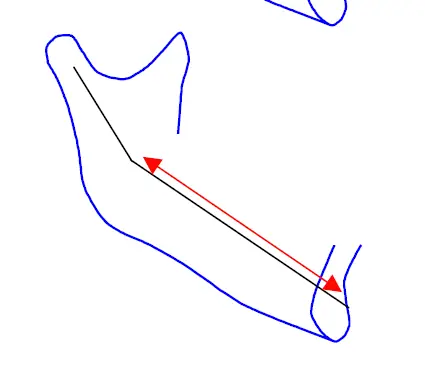
Used to determine the length of the mandible.
Measured along Corpus Axis from Xi point to PM.
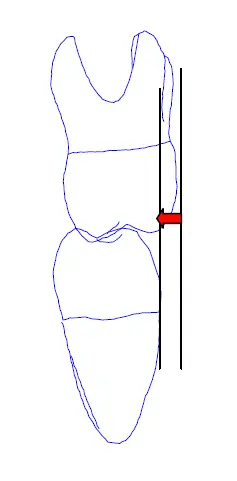
Used to describe buccal/lingual occlusion of the first molars.
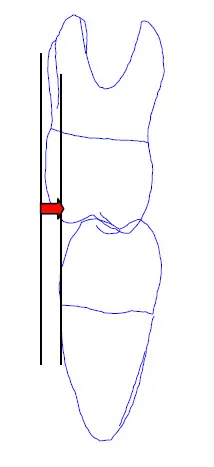
Used to describe buccal/lingual occlusion of the first molars.
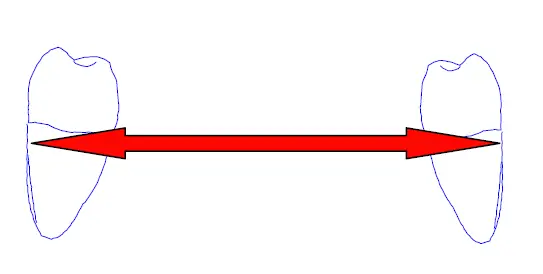
Used to describe the width of the mandibular arch in the posterior section. This may be helpful in determining the cause of a crossbite.
Measured from the buccal surface of the mandibular left first molar to the buccal surface of the mandibular right first molar.
Used to describe the width of the mandibular arch in the anterior section.
Measured from the tip of the mandibular right canine to the tip of the mandibular left canine.
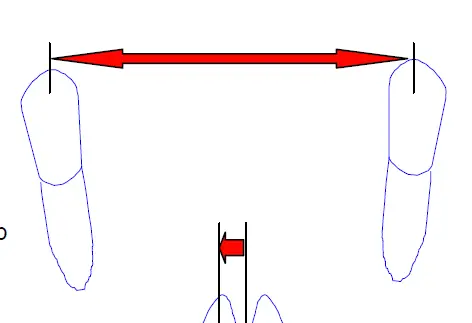
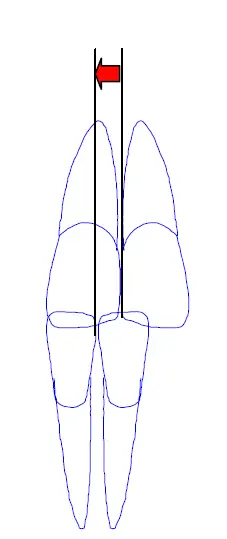
Used to describe a dental mid-line discrepancy.
Measured from the mid-line of the upper arch to the mid-line of the lower arch.
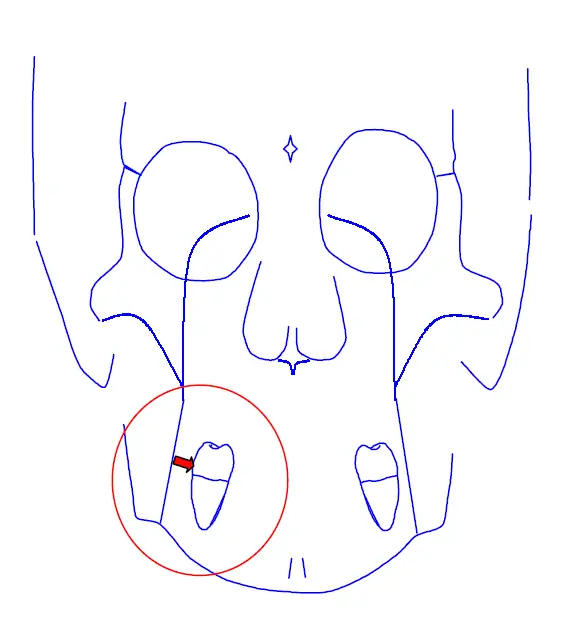
Used to describe the relation of the lower molar to the jaws.
Measured from the buccal surface of the lower left first molar to a plane from the Jugal Process to the Antigonial Notch.
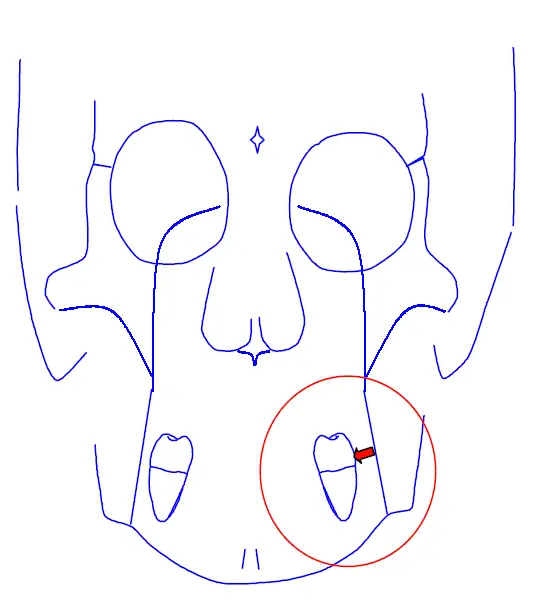
Used to describe the relation of the lower molar to the jaws.
Measured from the buccal surface of the lower right first molar to a plane from the Jugal Process to the Antigonial Notch.
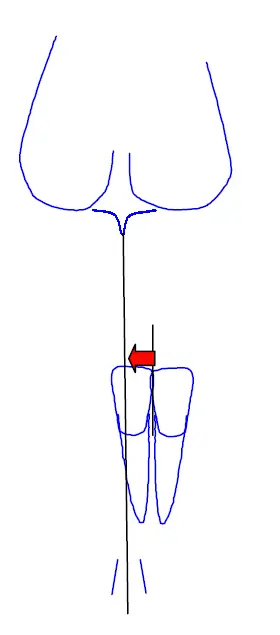
Used to compare skeletal to dental mid-lines.
Measured from the mid-line of the denture to the mid-line of the jaws (ANS - Me).
Describes the difference in the height of the Occlusal Plane to the ZL-ZR Plane.
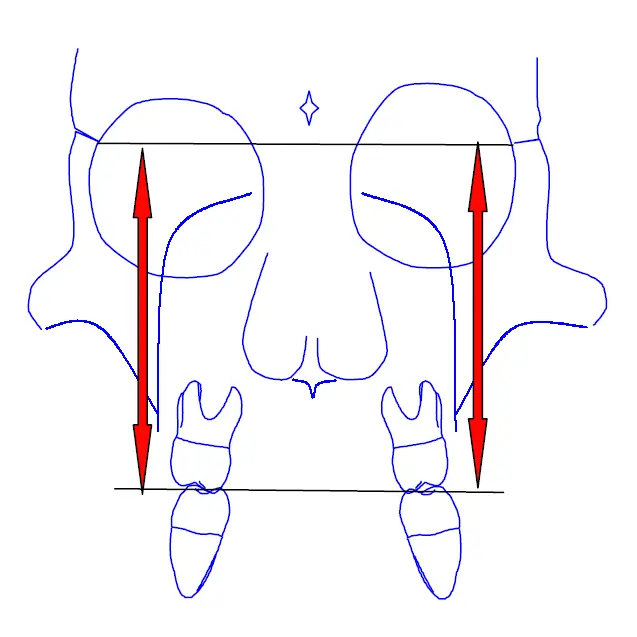
The ratio of the mesial-distal sizes of the lower to the 6 upper anterior teeth.
Ratio of the mesial-distal tooth sizes of the lower arch to the upper arch.
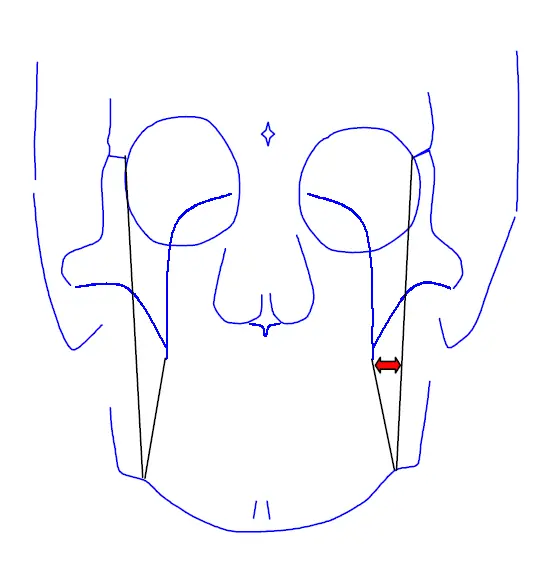
Used to describe a skeletal crossbite.
Measured from the Jugal Process to the Frontal Facial Plane.
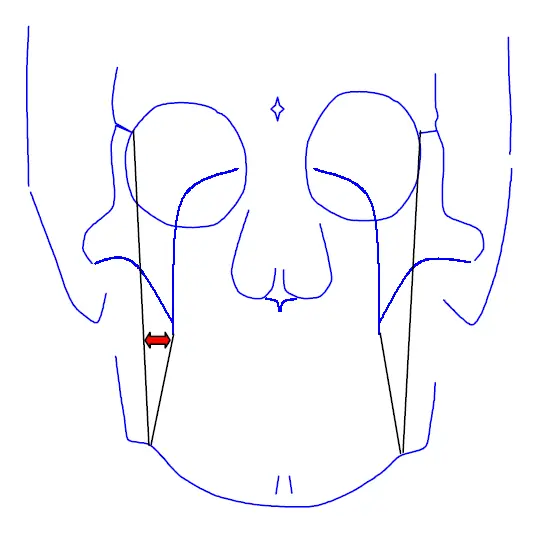
Used to describe a skeletal crossbite.
Measured from the Jugal Process to the Frontal Facial Plane.
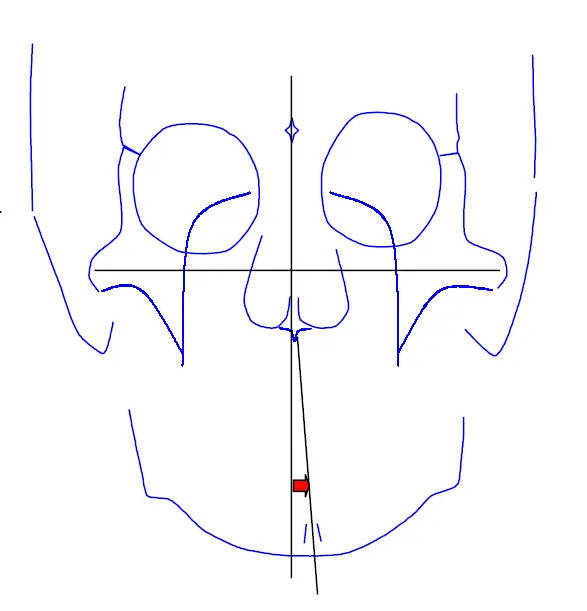
Used to describe a skeletal mid-line discrepancy.
Measured by the angle formed by the ANS-ME Plane to a plane perpendicular to ZA-AZ Plane.
Used to determine the cause of asymmetries.
Measured by the difference in the angles (left and right) formed by a plane from the Zygomatic Frontal Suture to Antigonion and Antigonion to the Zygomatic Arch.
NOTE: This measurement is greatly affected by patient positioning on the head film.
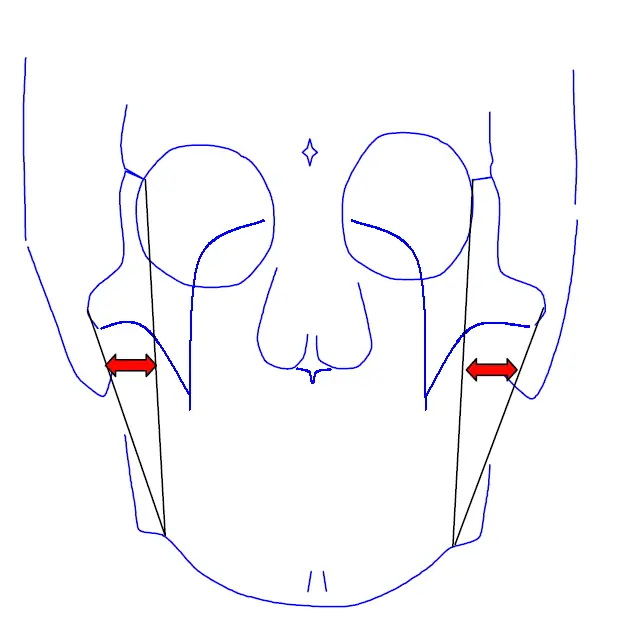
Used to determine the width of the maxilla and the possible cause of skeletal crossbite.
Measured by the distance between the right and left J points.
.webp)
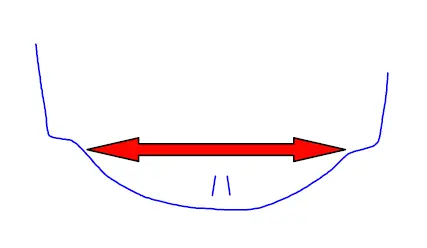
Used to determine the width of the mandible and the possible cause of skeletal crossbite.
Measured by the length of the AG-GA Plane.
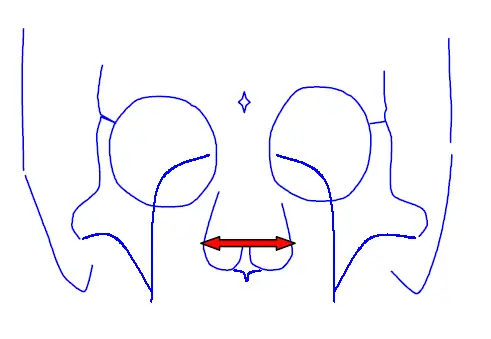
Describes the width of the nasal cavity and may be used to determine the cause of mouth-breathing.
Measured from the widest aspects of the nasal cavity.
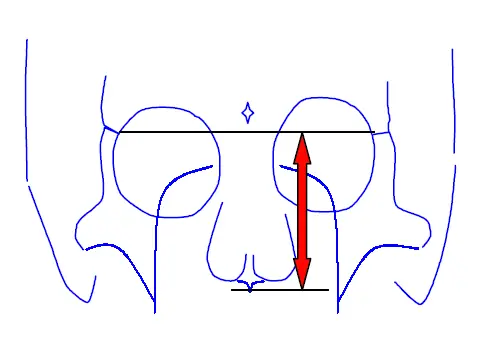
Describes the height of the nasal cavity.
Measured by the distance from the ZL-ZR Plane to the anterior nasal spine.
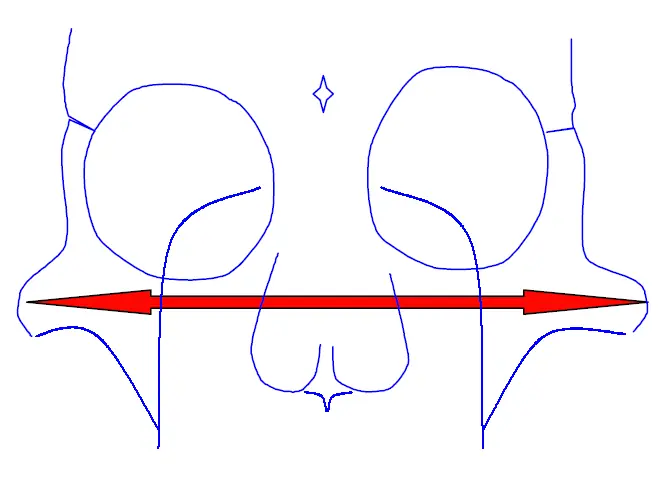
Describes the width of the face at the Zygomatic Arches. This may be useful in facial typing and expansion decisions.
Measured by the distance from ZA to AZ.
The summary analysis is a simplified version of the Comprehensive Cephalometric Description. Although it is far from being a comprehensive evaluation of craniofacial cephalometrics, it does provide an initial overview of the patient's condition.
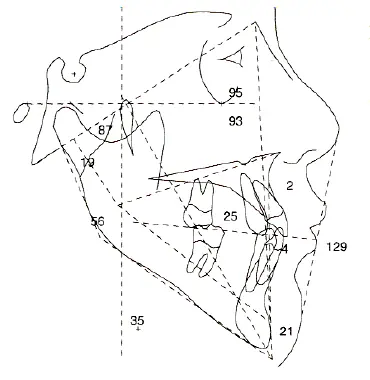
The linear and angular measurements of the Summary Analysis are illustrated below and described on the following pages. The norms and clinical deviations are those of a "normal" nine-year-old Caucasian child. Average rates of change as a result of growth are also presented so that the clinician can estimate the proper measurement for a patient of any age.
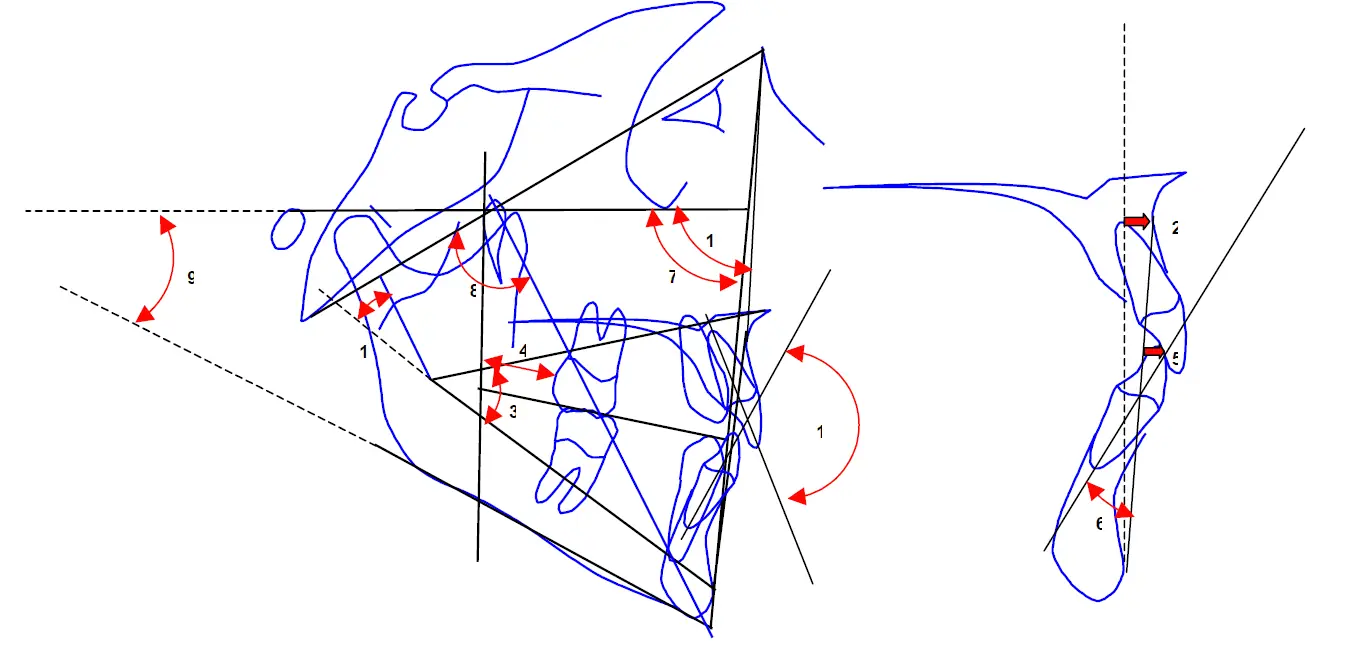
1. Interincisal Angle: This measurement is formed by the intersection of the long axis of the lower and upper central incisors. It describes both the vertical and horizontal dimensions of the occlusion of the incisors. The mean measurement is 130 degrees ± 6 degrees, and remains constant with age.
2. Convexity of A Point: Convexity is the distance in millimeters from A point to the Facial plane, measured perpendicular to that plane. In most instances, the mandible grows more anteriorly than the maxilla. Therefore, convexity decreases by approximately 1 mm every 3 years. The norm at age 9 is 2.0 mm ± 2.0 mm.
3. Lower Facial Height
This is the angle formed by the intersection of a line from anterior nasal spine (ANS) to Xi point and the Corpus axis (Xi-PM). A larger than normal angle indicates a skeletal open bite (mandible and maxilla diverge). Similar to the Facial Axis angle, the Lower Facial Height also does not usually change significantly with age unless treatment mechanics open or close the bite. The norm is 45 degrees with a clinical deviation of 4 degrees.
4. Upper Molar Position
Upper Molar Position is the linear distance between the most distal point of the maxillary first permanent molar, and the Pterygoid Vertical (PTV) measured parallel to the Occlusal plane. This measurement indicates to the clinician the protrusion of retrusion of the upper denture. It is also indicative of whether or not the upper molar can be moved distally without impacting the maxillary second and third molars. It is interesting to note that the norm is the patient's age (in years) plus 3 mm. Therefore, for a nine-year-old child, the mean is 12 mm. At least 21 mm is generally needed in later years for proper eruption of the second and third molars. The standard deviation for this measurement is 3 mm.
5. Lower Incisor Protrusion
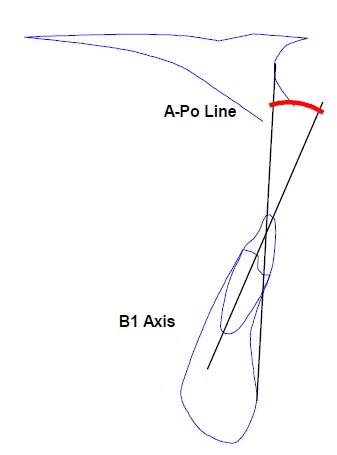
This linear measurement relates the position of the tip of the lower central incisor to the maxillo mandibular relationship. The plane used to describe this relationship intersects both A point and Pogonion (A-Po). The distance from the tip of the incisor is measured perpendicular to this plane. The position of the lower incisor has been associated both with esthetics and stability. The position of the lower incisor is the key to orthodontic treatment planning. Any anterior or posterior movement of the lower incisor will affect arch length. This measurement plays a vital role in determining the need for extraction. The norm for Caucasian patients is + 1 mm + or -2 mm and remains constant with age.
6. Lower Incisor Inclination
The angular measurement formed by the intersection of the long axis of the lower central incisor and the A-Po plane is called the Lower Incisor Inclination. This measurement also relates the lower incisor to the maxillomandibular relationship. The mean measurement is 22 degrees + or - 4 degrees, and as with the linear measurement, remains constant with age.
7. Facial Depth
This measurement is the angle formed by the intersection of the Facial plane and the Frankfort Horizontal plane. This angle gives the clinician an indication of the anterior-posterior position of the most anterior point of the mandible (Pogonion). The norm for a nine-year-old child is 87 degrees + or - 3 degrees. This angle increases 1 degree every 3 years as the mandible grows forward. Therefore, in adulthood the mean measurement is 90 degrees.
8. Facial Axis Angle
This angle is formed by the intersection of the BAsion-Nasion line and the Facial Axis. It describes the direction of growth of the chin. A larger than normal angle indicates that the direction of mandibular growth has been and will be more horizontal that vertical. The growth pattern is said to be more vertical when this angle is less that normal. An important clinical finding regarding this measurement is that it changes little, if any, with age if the patient is growing normally, Therefore, any significant changes are the result of treatment mechanics, a functional or an environmental factor. The clinical norm is 90 degrees + or - 3 degrees.
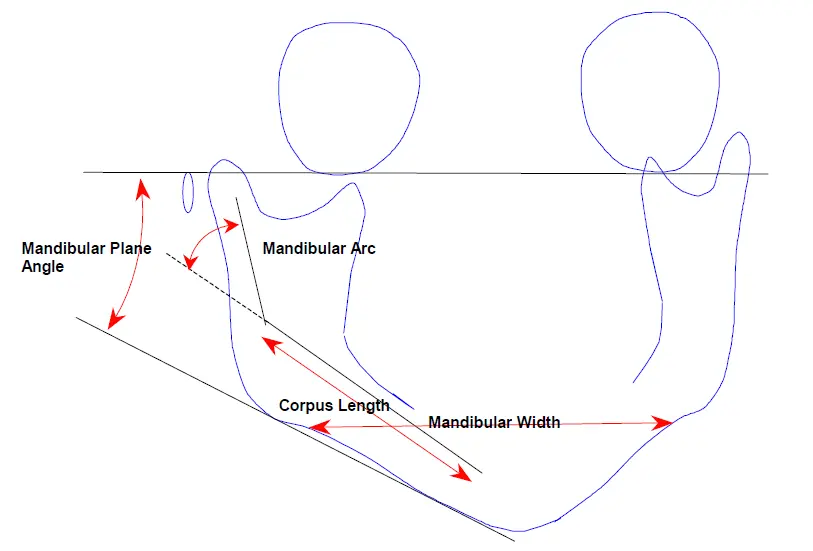
9. Mandibular Plane Angle: The Mandibular Plane Angle is formed by the intersection of the Mandibular plane and the Frankfort Horizontal Plane. This angle gives the clinician an indication of the cant of the mandibular corpus. Dolichofacial patients with weak musculature or vertical growth problems tend to have high Mandibular Plane Angles. Brachyfacial types with strong musculature and deep bites tend to have square jaws which result in low Mandibular Plane Angles. The norm for this angle at age 9 is 26 degrees ± 4.5 degrees. This angle decreases 1 degree every 3 years until maturity, as a result of growth and adaptive changes that occur to the mandible during normal development.
10. Mandibular Arc: The Mandibular Arc is the angle formed by the intersection of the Condylar axis (DC-Xi) and the distal extrapolation of the Corpus axis. The most significant clinical application of this measurement is that it describes the configuration of the mandible. A large angle is indicative of a "strong" and "square" mandible; a small angle represents a lower jaw with a short ramus and vertical growth pattern. The norm for a nine-year-old child is 26 degrees ± 4 degrees and increases approximately 0.5 degrees per year with growth.
11. Maxillary Depth: Maxillary Depth is the angle formed by the intersection of Frankfort Horizontal and a line from Nasion to hard tissue A Point. This is used to relate the maxilla to the upper face; high angles indicate a protrusive maxilla, low values indicate a retrusive maxilla. The norm for a Caucasian patient is 90 degrees ± 3 degrees. In most instances the maxilla and cranium grow anteriorly at the same rate. This measurement remains constant with growth.
The following table summarizes this discussion:
| Measurement | Norm Age 9 | Clinical Dev. | Mean Change/Year |
|---|---|---|---|
| 1. Interincisal Angle | 130° | ± 6° | No change with age |
| 2. Convexity | 2 mm | ± 2 mm | Change = -1 mm every 3 years |
| 3. Lower Facial Height | 45° | ± 4° | No change |
| 4. A6 to PTV | 12 mm | ± 3 mm | Change = +1 mm/year |
| 5. B1 to A-PO Plane | +1 mm | ± 2 mm | No change with age |
| 6. B1 Inclination to A-Po | 22° | ± 4° | No change with age |
| 7. Facial (Angle) Depth | 87° | ± 3° | Change = +1° every 3 years |
| 8. Facial Axis | 90° | ± 3.5° | No change with age |
| 9. Mandibular Plane to FH | 26° | ± 4.5° | Change = -1° every 3 years |
| 10. Mandibular Arc | 26° | ± 4° | Increases 1/2° per year |
| 11. Maxillary Depth | 90° | ± 3° | No change with age |
Ricketts, in his Foundations of Cephalometric Communication, stated: "Analysis is thus determined by emphasis on the features or characteristics of the object rather than the thoughts or feelings of the operator."
"The philosophy of the cephalometric survey is that the clinician wants first of all to recognize a problem, if one exists, and then to deal with it more specifically if necessary."
If measurement is to be developed, a zero point must be selected on the ruler, and a concept formulated as to what is big and what is small. It is useful to consider the concept of a norm; that is, some meaningful zero point which can be used as a base from which to measure for the purpose of communication. Measurements above the mean would indicate that the individual was larger than normal; below the mean, smaller than normal. Norms, as they are applied to cephalometrics, are not averages. An explanation of this phenomenon follows.
The pictures presented represent the lateral and frontal "norms" or standards for an adult Caucasian male patient. However, these cephalometric drawings are an ideal. They are not an average or mean. The average patient will deviate from the norm somewhat. The reason for this discrepancy is that craniofacial norms are usually derived from samples featuring ideal dental occlusions. The average or mean occlusion is, unfortunately, less than ideal.
Just as standards of length have been established, such as a meter or a foot, so that we may relate various distances for communication, the standard face is presented to allow the clinician to communicate differences in facial types. The standard presented is useful in that many individuals lie close to this facial pattern. However, significant deviations from the pattern have significant clinical interpretation.
A meaningful set of norms is the foundation of cephalometrics. However, before such a standard can be useful, there are three problems to resolve:
1. What population should be used to extract the norms?
2. What measurements should be made?
3. What interpretation may be placed upon a given deviation from the norm?
In comparing a patient's tracing to the norm, it is important that the patient be a member of the population from which the norm was derived. Differences in the population can occur as a result of diet, climate, local standards of beauty, etc. It is an open question as to whether various standards which account for these characteristics should be developed. However, it is nearly universally agreed that there are several other factors that must be considered.
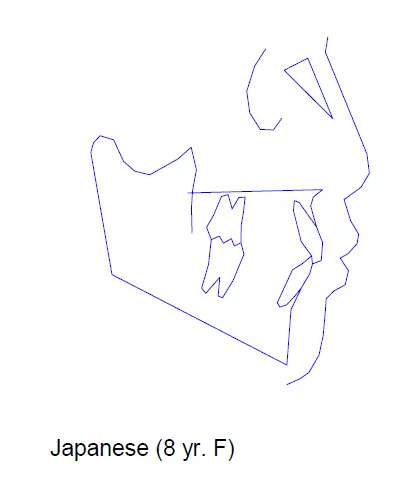
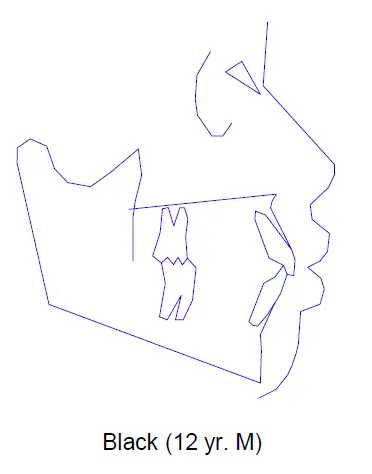
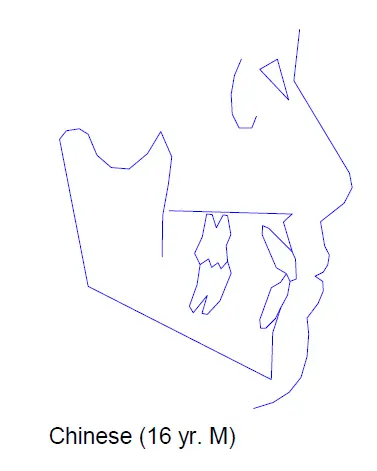
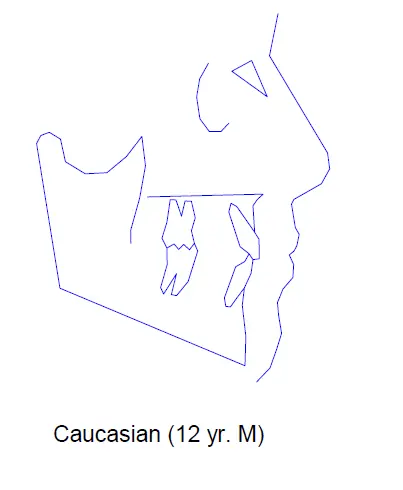
Certainly, racial group must be taken into account. It has been shown that samples of Caucasians, Japanese, and American Negroes with ideal dental occlusions exhibit divergent craniofacial cephalometric characteristics. Age must also be a factor. It has been shown time and time again that various cephalometric angles, as well as overall head size differ with age. It can also be stated that because of different rates of maturation and overall facial dimensions, male and female can exhibit different norms.
It is therefore worthwhile to develop different norms according to age, sex, size, and race. The norms appearing in this book reflect these factors.
One of the original intentions of norms was not to take measurements at all, but to devise a template so that an x-ray or tracing could be compared directly with a visual picture of what is "normal". This methodology has two advantages:
1. It is possible to visualize the abnormal.
2. For presentation of scientific work, it is more useful to display a complete visual drawing of the normal so that, regardless of the particular measurement being analyzed, the standard for that measurement is on the drawing.
There are occasions in which cephalometric numerical values are essential. Descriptions of the measurements can be found under C.C.D. / Measurements / Degree of Complexity.
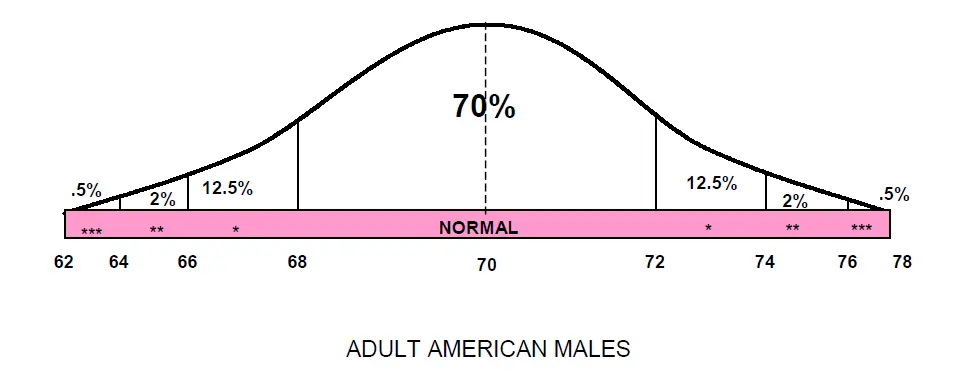
What is a significant divergence from the Norm? One answer employs the statistical concept of standard deviation (FMBODS utilizes clinical deviations which are further adjusted for x-ray distortion). As an example, let us consider adult height of American males. The norm, which is the average in this case, is 70 inches. The standard deviation is approximately 2 inches. Therefore, all adult American males whose heights fall between 68 inches and 72 inches are within one standard deviation of the norm.
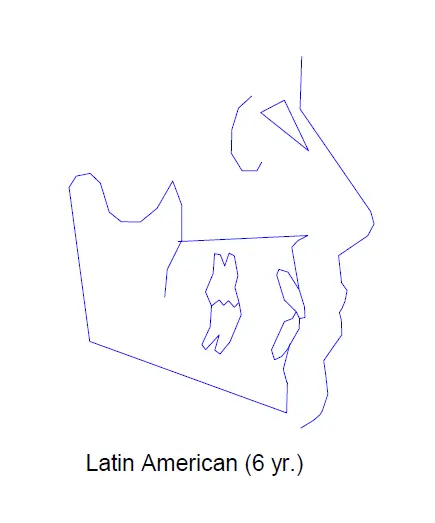
Most biologic variables, including height, are distributed according to the normal distribution. All normal distributions can be represented by a bell shaped curve. In any normal distribution, 70% of the population lies within one standard deviation from the norm and 95% of the population lies with two standard deviations from the norm (between 66 inches and 74 inches). If we wanted to quantify what is meant by "short" or "tall", we might refer quantitatively to anyone not within two standard deviations from the norm.
There are practical consequences to a deviation from a norm beyond mere statistical abnormality. Conversely, there are a number of benefits to be derived from treatment toward cephalometric norms.
These advantages include:
1. Improved function and long-term health,
2. A more esthetically pleasing result,
3. A more stable result.
These three factors are examined below.
Those individuals whose cephalometric measurements lie close to the norms function better and have fewer health problems than others.
Geiger and Wassermann have shown a connection between incisor inclination and periodontal status. Those individuals with inclinations of the mandibular incisor to GO-GN less than 85 degrees showed considerably more gingival recession and periodontal destruction than other patients. In addition, cases deviating significantly from normal in overbite (i.e., open bite or deep bite) showed a tendency for greater periodontal destruction. Cases with greater crowding of the mandibular incisors showed more inflammation.
Several authors have shown that a relationship exists between Class II, Division 1 malocclusion, condyle position, and temporomandibular joint disturbance. Areas of function, such as efficient
mastication, are now under study. Hershey, Steward, and Warren have demonstrated a decrease in nasal air resistance following palate separation.
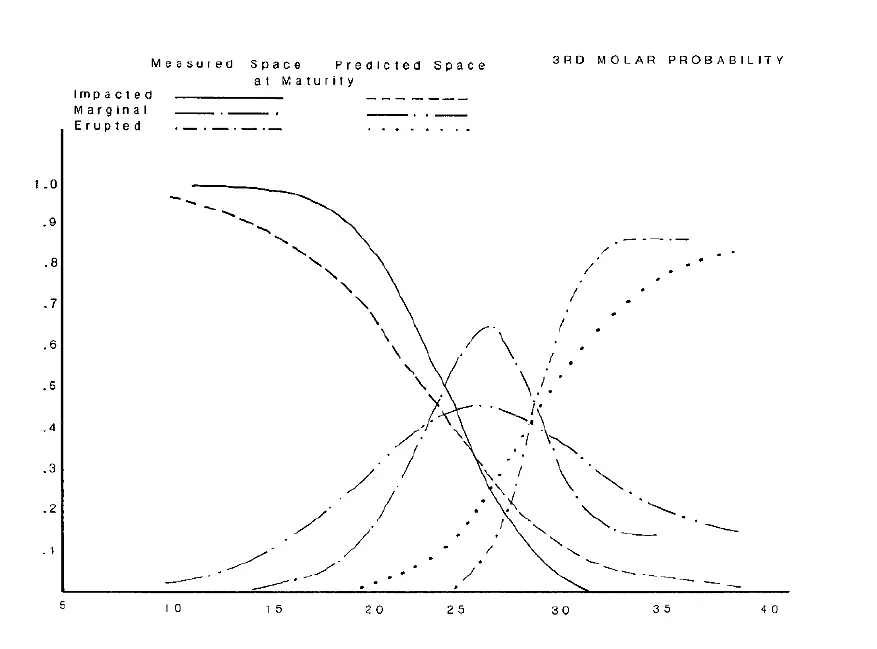
Turley has shown a significant relationship between third molar impaction and the third molar space as calculated from Xi Point, the center of the ramus, to the second molar. Thus, cases can be treated orthodontically in order to increase the probability of fully functional third molars.
Health also includes mental status and many investigators feel the psychological impact of visually perceptible abnormalities may indeed be great. Ackerman has suggested that a major criterion for treatment can be the effect of the individual malocclusion on the patient's psychological health and whether this indeed constitutes a handicap for him.
Reidel has shown a relationship between the lower lip and the Esthetic Plane. Different groups of people were asked to examine profiles and to determine which seemed pleasant and which did not. Subjects with the Lower Lip Point (LL) falling immediately behind the Esthetic Plane were regarded as most pleasing.
Holdaway, in his studies of beauty contest winners, developed the Harmony Line. He has determined the relationship between patient lips and the harmony line to be of esthetic significance. Further analysis of this sample has shown that patients with "more attractive" lips possess a facial structure different from the "average" person in that they are biased toward a brachyfacial tendency.
Orthodontically treated cases in which the result approximates the cephalometric norm are more stable (i.e., show fewer relapses) than all others. Numerous studies exist which support this hypothesis. A small sampling of these results is presented here.
Stability of the lower incisor, both vertically and horizontally, has long been a major concern in orthodontics. Many reference lines have been suggested as guides to stability. These include the A-PO Plane, Mandibular Plane, and the NA-BA Plane. Allen showed that those cases treated to a more upright lower incisor inclination have somewhat less crowding. McAlpine has shown that deep bite cases treated to an intercisal angle within 10 degrees of the statistical average (130° ± 10) showed significantly less deep bite relapse than those treated to more extreme values. It was found that cases in which the lower central incisor was orthodontically treated to 1 mm anterior of A-PO were more stable than others.
Schuller demonstrated that patients exhibiting a greater than normal distance from the lower molar to the frontal denture plane following treatment were less likely to experience relapse than all other cases. His data also indicated that those patients treated to a normal intercuspid width showed less relapse than those finished to values above the norm.
From the above discussion, it is evident that the quantification of facial characteristics as measured in a cephalometric head film has allowed the demonstration of clinical orthodontic concepts. Such a demonstration would not be possible in a non-quantified environment, and indeed the profession would be left with the conflicting opinions of so-called "experts".
Once the lateral and frontal cephalometric anatomical tracings have been made, it would be helpful for the clinician to make certain judgments regarding the interarch and facial characteristics of the patient. In the remainder of this section, various basic classifications of patients, based on the analysis of cephalometric tracings, are discussed. These classifications are commonly seen in the orthodontic literature and will be used throughout the remainder of this text.
Certain malocclusions are associated with specific "Facial Types" and it is important for the clinician to classify the common facial characteristic of each patient. This task is important not only for initial classification, but also in planning treatment of existing problems, and in the early determination of the prognosis of the treatment. Basically there are three distinct facial types or patterns under which almost all malocclusions can be classified.
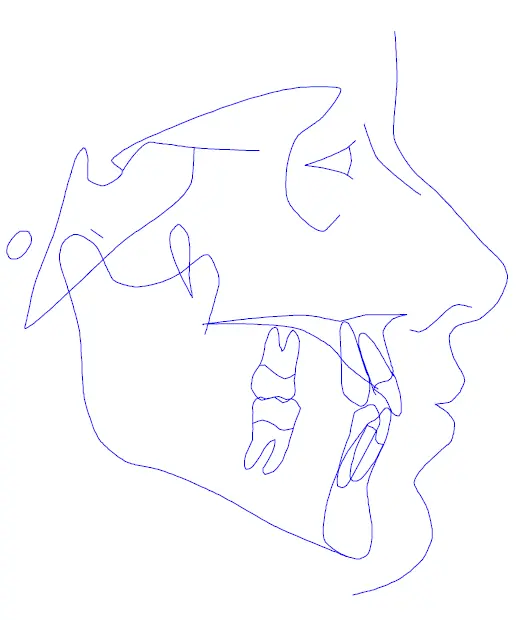
Class I occlusions frequently have a normal maxillomandibular relationship with harmonious musculature and a pleasant tissue profile. The face is neither too long nor too wide and is associated with similar jaw characteristics and dental arch configurations. The prognosis for orthodontic treatment is usually very favorable because of the aforementioned characteristics.
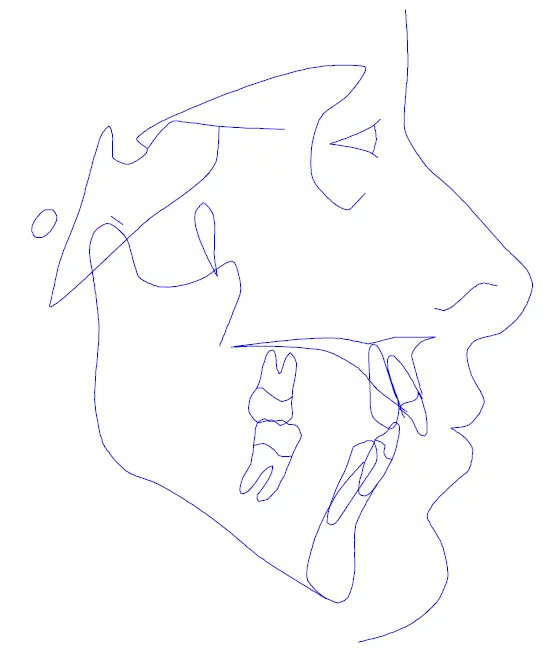
This pattern is usually associated with Class II, Division 1, Malocclusions. The face is long and narrow and the dental arches frequently exhibit dental crowding. The musculature is "weak", the mandibular gonial angle is obtuse and, more often than not, the patient exhibits an anterior open bite tendency due to the vertical growth pattern of the mandible. The characteristics of this facial pattern may cause difficulties during orthodontic treatment. The soft tissue may be strained due to excessive anterior vertical height, especially if the teeth are protrusive. Also, because of the narrow face and nasal cavities, the patients with a dolichofacial pattern are the most likely ones to exhibit upper respiratory problems.
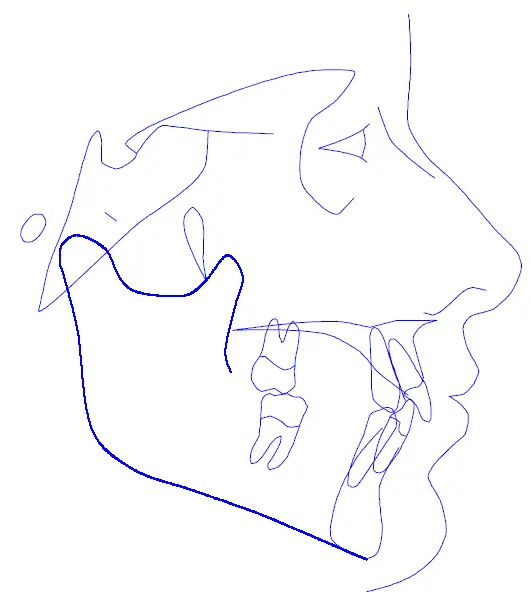
This facial pattern is typically seen in Class II, Division 2, malocclusions. The face is short and wide, the mandible is "strong" and "square", and the dental arches are also broad when compared to the ovoid Class I and the narrow Class II, Division I, arches. Patients with a brachyfacial pattern usually exhibit deep anterior overbites, which are often skeletal discrepancies. The mandibular vector of growth is usually more forward than downward, producing a favorable prognosis of orthodontic treatment. The majority of untreated ideal occlusions found in the population exhibit brachyfacial tendencies as this muscle growth pattern is very favorable to normal dental development.
As described there are three basic facial patterns, dolichofacial (vertical), mesofacial (normal), and brachyfacial (horizontal). Facial pattern is an important factor in growth prediction and in treatment planning. The first step in craniofacial diagnosis is classification of the patient's facial type. The following diagram illustrates the manner in which the magnitude of these measurements helps to classify the patient's facial type.
| Measurement | More than 1cd below norm | Within 1cd of norm | More than 1cd above norm |
|---|---|---|---|
| Facial Axis | D | M | B |
| Ramus Height | D | M | B |
| Mandibular Plane Angle | B | M | D |
| Lower Facial Height | B | M | D |
| Mandibular Arc | D | M | B |
This table can be used to develop a scheme for describing the facial pattern of the patient more precisely.
For each of the five facial classification measurements, the number of clinical deviations from the norm is calculated. All measurements which are more dolichofacial than the norm are given a minus sign. All measurements which are more brachyfacial are assigned a plus. The five signed clinical deviations are then averaged. The resulting number is called Vertical Description (amount of vertical growth). If Vertical Description is significantly negative, the patient is dolichofacial. The larger the negative number, the more dolichofacial the patient. Similarly, a highly positive number indicates an extremely brachyfacial patient. A useful descriptive guideline for using Vertical Description appears below.
| Facial Pattern | Severe Dolicho | Dolicho | Mild Dolicho | Meso | Mild Brachy | Brachy | Severe Brachy |
|---|---|---|---|---|---|---|---|
| Clinical Deviation | -2.0 | -1.0 | -0.5 | 0 | 0.5 | 1.0 | 2.0 |
Basic cephalometrics is purely a static system.
The dynamics of craniofacial growth must also be considered. No matter how detailed a system is devised to evaluate a patient's current state, that method will not be sufficient for planning treatment. Patient characteristics are constantly changing, especially in a growing child. Therefore any method of patient evaluation must take growth into account. This section deals with the incorporation of craniofacial growth prediction into the method of diagnosis and the use of the resultant data in treatment planning.
The graph below contains several curves which depict relative amounts of normal craniofacial growth at various ages for American Caucasians. The reader will note that there are three types of curves: One for cranial base, one for the mandible, and one for soft tissue. These three structures grow at somewhat different rates during the course of maturation. Note that both males and females exhibit similar types of curves. There is a large amount of growth early in life, a little prior to puberty, a pubertal growth spurt, and then a rapid tapering off as the patient approaches maturity.
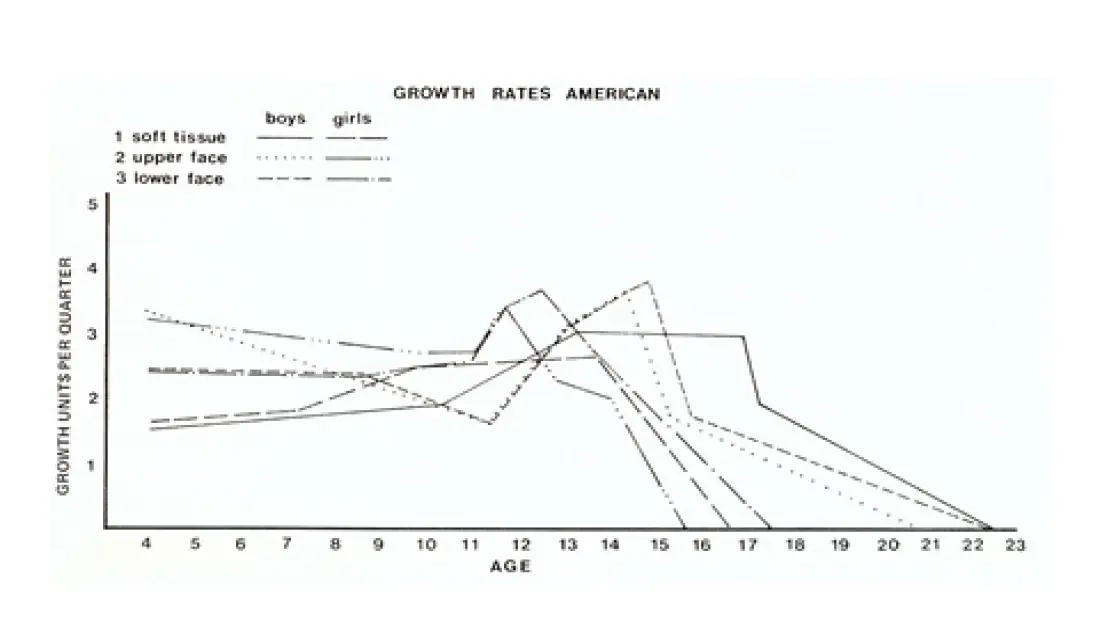
Although there is considerable variation in growth among individuals, a comprehensive norm or standard picture can be used to describe growth behavior. As is the case with the basic analysis norms, various population groups have patterns of growth which differ slightly from each other. Shown here are growth curves for samples of German and Japanese children, respectively. While all three sets of curves are quite similar, differences remain which, if not taken into account, can affect treatment planning adversely. One advantage of employing a computer to develop growth predictions is that the data contained in the various growth curves can be used precisely.
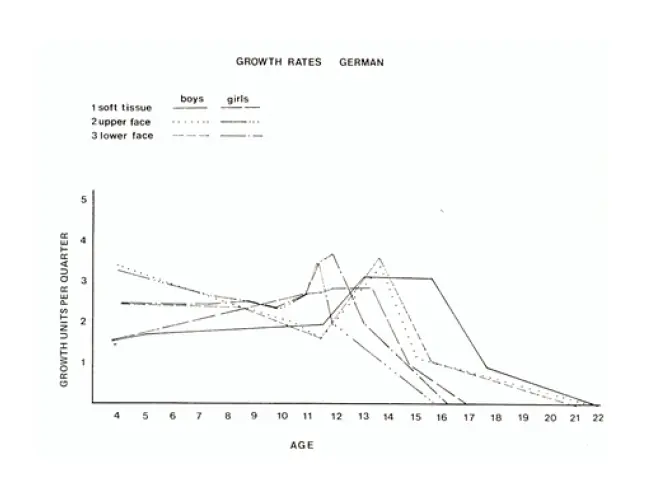
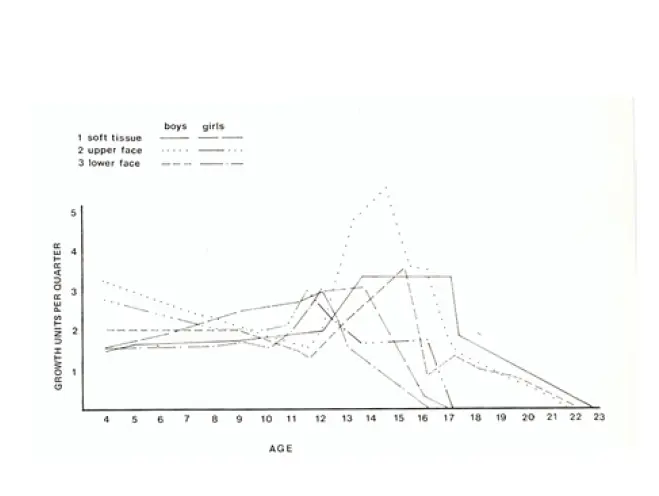

The FMBODS Diagnostic Service computer performs growth simulations by combining these growth curves with individual average directions and amounts of change per year for approximately 200 cephalometric landmarks.
The units of measurement shown in the previous growth graphs are called quarter growth units. A growth unit is defined as the average amount of growth observed for the average patient adjusted for race and gender in a typical period. For each cephalometric landmark the amount of change in position (relative to the intersection of FH and PTV) per growth unit, and the direction of change per growth unit are known. Thus, in the average computer forecast the computer will determine the amount of growth units which will elapse during the period being simulated. Next, the change for each point (direction and amount) per growth unit is multiplied by the number of growth units and then re-plotted. The result is a computer Growth Forecast Without Treatment shown below.
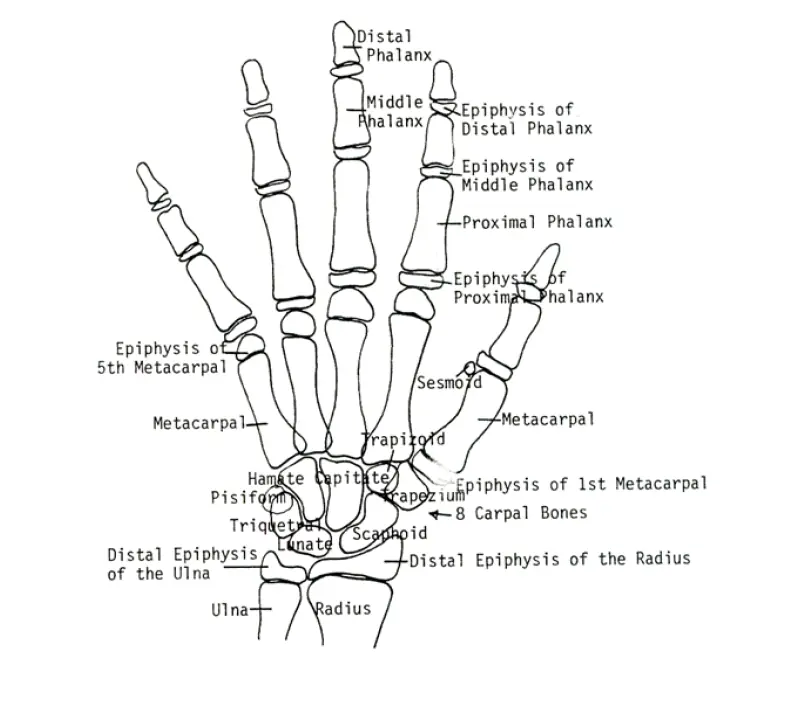
At FMBODS the skeletal age can be one of the most critical pieces of information used when predicting growth and planning treatment.
The computer takes into account four different growth curves for each patient. One for total body height, one for soft tissue growth, one for the cranial base, and one for the mandible. Of these curves there are different sets selected by race and gender and then further subdivided by skeletal age. This final subdivision is used to classify which patients are "normal" growers and which fall into the advanced or retarded growth categories.
Once the correct set of curves have been selected for the individual, the computer can more accurately simulate the effects of growth and treatment.
When planning treatment for a growing patient it is important to consider how much growth will or will not occur within the treatment time. The skeletal age can be extremely valuable in determining the remaining growth in late adolescence.
Miscalculations of this factor may extend the planned treatment time or call for major deviation from the original treatment plan.
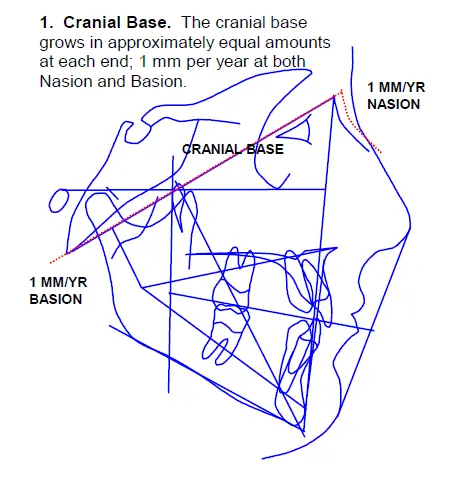
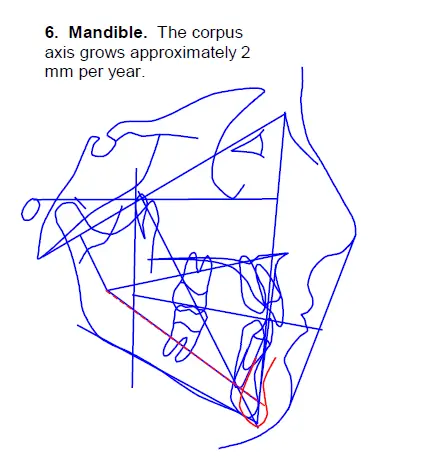
The FMBODS computer growth forecast yields several noteworthy findings with regard to the angles and planes defined in the previous section. The figures below represent approximate average increments of growth per year. These values enable the clinician to gain a general perspective of craniofacial growth.
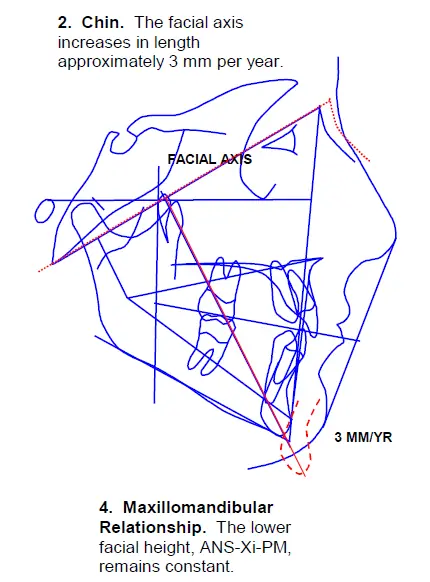
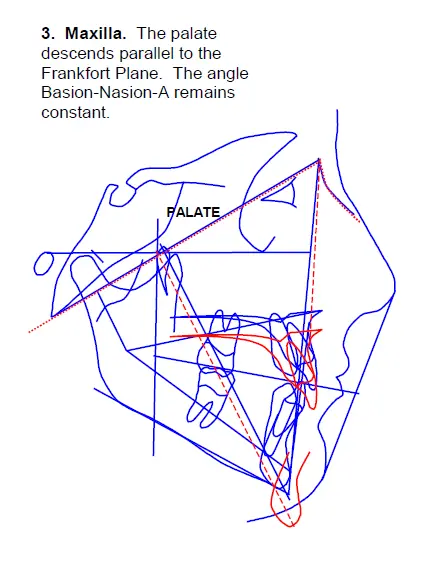
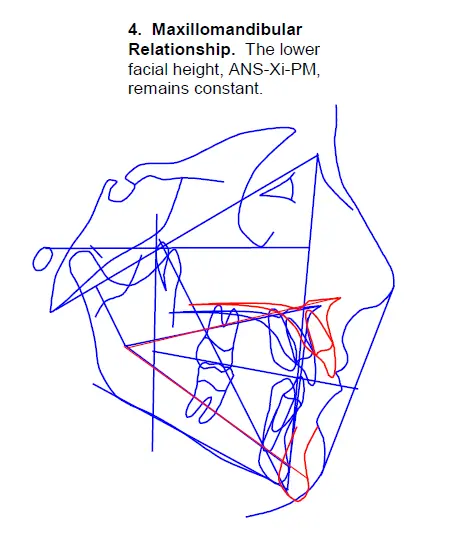
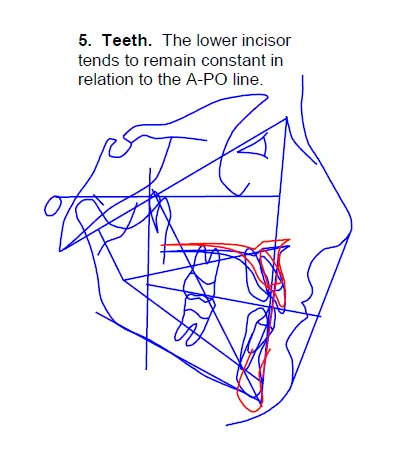
The profile changes with age.
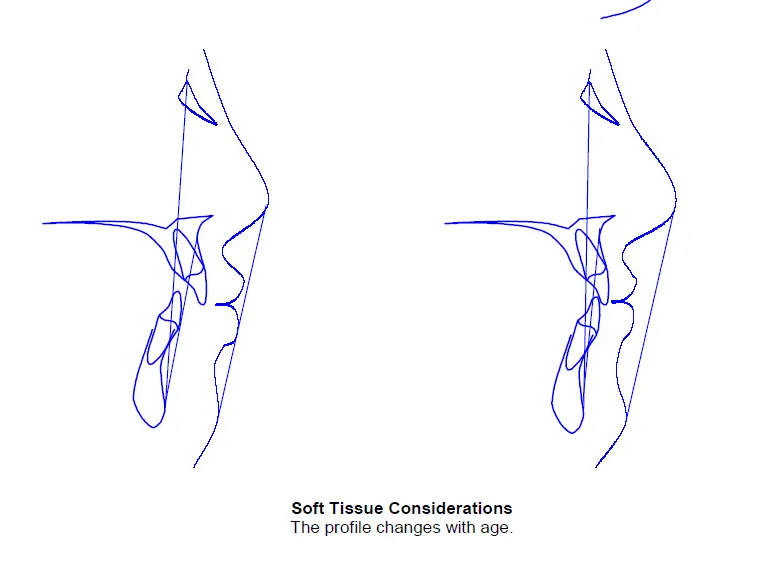
1. Amount of growth. The most significant factor in evaluating growth is not absolute chronologic age, but biologic rate of maturation. Growth occurs in spurts and differs substantially between early and late maturers.
2. Direction of growth. Facial pattern strongly dictates vector: dolichofacial patterns grow vertically with mandibular rotation downward and backward; brachyfacial patterns grow horizontally with strong forward mandibular advancement.
The combination of individual variations in rate and direction must be evaluated through accurate longitudinal cephalometrics and computer forecasting models.
The VTO should be performed with long term results in mind. Unlike the manual VTO in which only those skeletal changes predicted to take place during treatment are considered, the computer VTO is based upon information found in the growth forecast to maturity. Certainly the maxillo-mandibular relationship seen two years after the start of treatment in a growing child may not be the same at maturity. Therefore, a case treated to proper balance at age 12 may prove to be a failed result at age 25. This consideration is especially true in cases predicted to experience an abnormally large amount of mandibular growth during the teenage years.
As an example of computer consideration of the growth forecast to maturity, let us use the measurement convexity. Presented is a tracing of a case with higher than normal convexity. In performing a manual VTO one might decide on a two year treatment plan in which the convexity is reduced to 1 mm at age 13. Normal growth would then result in a convexity of zero at maturity.
The computer prior to performing the VTO will provide a growth forecast to maturity. It is seen from the actual treated adult tracing that the convexity was reduced more than expected because of excessive mandibular growth. The computer-generated untreated growth forecast to maturity contains this information. Therefore, the computer long range VTO shows a more balanced skeletal relationship.
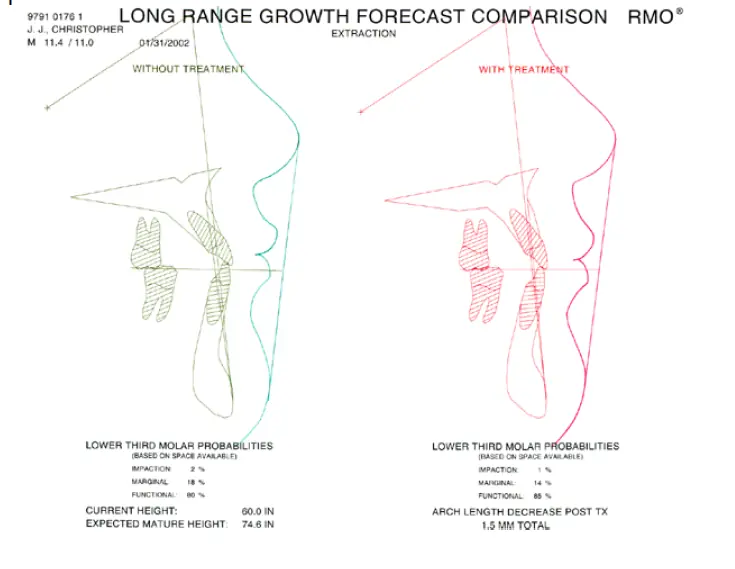
The computer technique is to simulate patient growth to maturity and then work backwards to perform a short term VTO.
The most prevalent type of abnormal growth is excessive mandibular increase. Over the years it has been found that certain craniofacial characteristics seem to go hand in hand with abnormal mandibular growth. The most obvious feature is a tendency toward Class III molar relation. However, not all Class III cases exhibit similar mandibular growth. The tracings below depict two Class III cases which, at first glance, look quite similar.
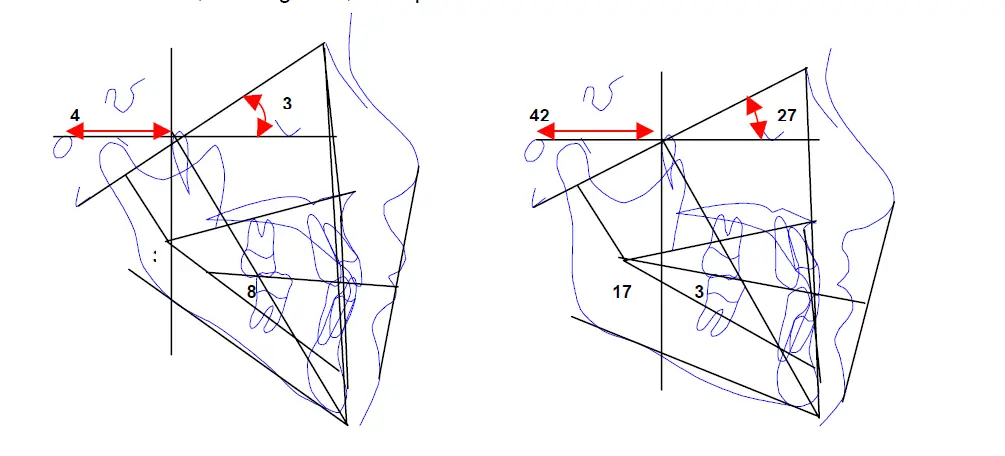
The following tracings are of the same two patients 8 years later. In one case (right) the mandible has grown quite normally. In the other instance (left) the mandibular increase is tremendous compared to the amount of increase in the rest of the craniofacial complex.
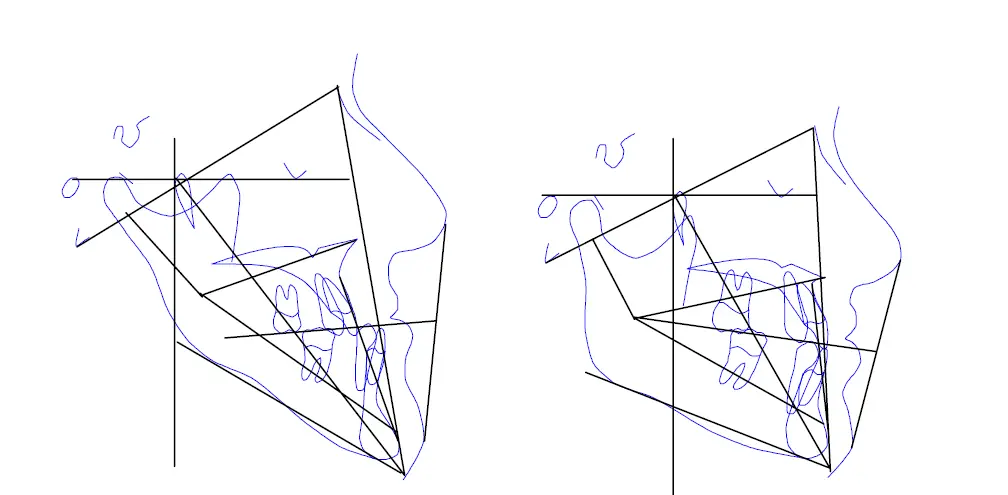
Several years ago four factors were found which are highly related to excessive mandibular growth. These measurements are Cranial Deflection, Porion Location, Ramus Position, and Lateral Molar Relation. The patient shown on the right, above, has relatively normal values for the measurements in question. The patient on the left exhibits high Cranial Deflection, short Porion Location, forward Ramus Position, and Class III Molar Relation. These are all telltale signs that excessive mandibular growth is likely.
The computer averages the number of clinical deviations from the norm of the four measurements. If this average is large, excessive mandibular growth is predicted. The amount of additional growth predicted along the corpus and condyle axes is directly related to the size of the average number of clinical deviations.
In cases where the computer determines the potential for excessive mandibular growth, a message is printed as part of the Summary Diagnosis and it also is printed on the Orthodontic Problem Analysis page. A special alert may be generated which can be used during the consultation.
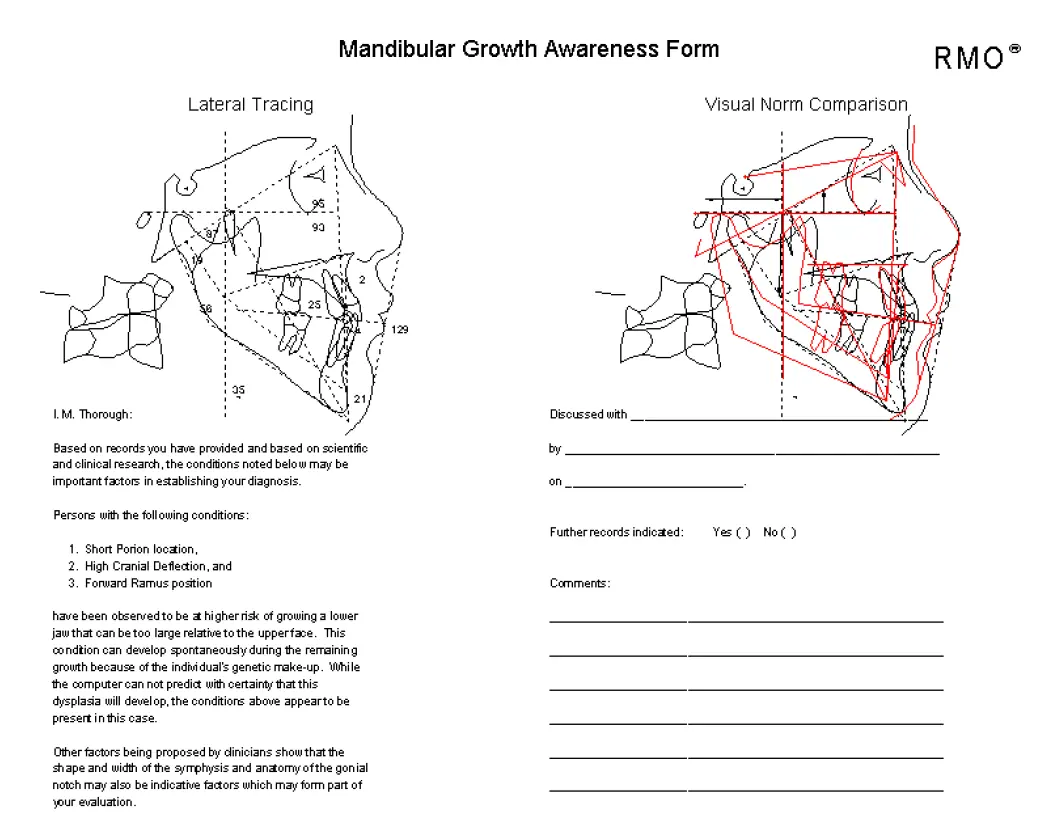
Other less common instances in which the computer will predict abnormal growth are certain Class II, Division 2, cases. When a Class II, Division 2, case is treated, there are times in which the unlocking of the malocclusion, in addition to the repositioning effect, results in excessive mandibular growth for a short period of time. This growth compensates for the earlier period in which mandibular growth was restrained due to the dental malocclusion.
The following case is a dramatic demonstration of the importance of the nasopharyngeal airway in orthodontics. It concerns a male with a sub-mucous cleft palate. When he was 12 and a half it was repaired by a pharyngeal flap. The unfortunate result of this operation was a complete closure of the airway and the patient becoming a mouth breather. Five years later a complete open bite had developed with a 6 degree opening of the facial axis. The chance of such an occurrence at random is less than one in a million. However, malocclusion in patients who are mouth breathers as a result of nasopharyngeal airway blockage is relatively common.
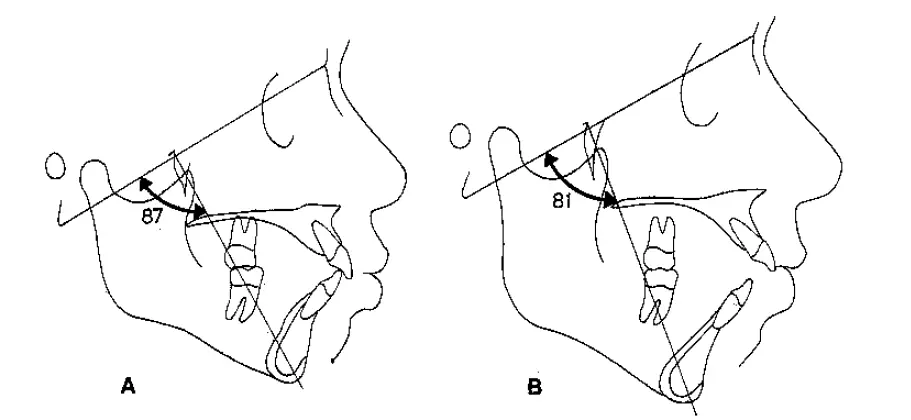
Mouth breathing has been a concern of clinicians for a number of years. Researchers have identified mouth breathing as a cause of various orthodontic problems. Some of these include Class II malocclusion, buccal crossbite, low tongue position, and vertical growth problems. In addition, mouth breathing has been regarded as an obstacle to successful orthodontic treatment. Therefore, it is important that the existence of mouth breathing in a child be discovered as soon as possible. Open bite malocclusion has actually been induced by Harvold (1972) in monkeys by artificially closing off the airway.
There are three possible causes of an impeded airway:
While it is the pediatrician's province to make the decision about the diagnosis and treatment of allergies, the orthodontist is in a unique position to answer the question:
Many clinicians are surprised to learn that the adenoid, tonsil, and nasopharyngeal airway can be observed and measured on a lateral cephalometric radiograph. During the past decade a number of researchers have used radiographs to develop methods to determine whether the adenoid is blocking the airway. Linder-Aronson has done what is probably considered to be the most complete study to date. He analyzed more than 200 craniofacial measurements in order to determine their relationship to the mouth breathing syndrome. In addition, he quantified changes in nasopharyngeal dimensions with age.
Ricketts analyzed several measurements that were not examined by Linder-Aronson. Bushey considered the effect of adenoidectomy on mouth breathing. Handelman described an accurate method to determine the dimensions of the nasopharynx and examined its growth with age as related to adenoid shrinkage.
All of the above measurements were tested by Pole for comparing mouth breathers with non-mouth breathers; eight measurements were found to be significant at the 0.05 level. Of these measurements the four most significant were selected to comprise a System. They were:
Then a random sample of 50 individuals from a University of Michigan study was analyzed at ages 6 to 16 to derive norms for this system. For any patient a comparison can be made between the appropriate norms and the patient's observed measurements in order to determine whether an adenoid blockage of the nasopharyngeal airway exists. If a patient who is a mouth breather has a normal adenoid (for his airway), a narrow nasal cavity, and a narrow maxilla (compared to the mandible), palate separation would likely be beneficial.
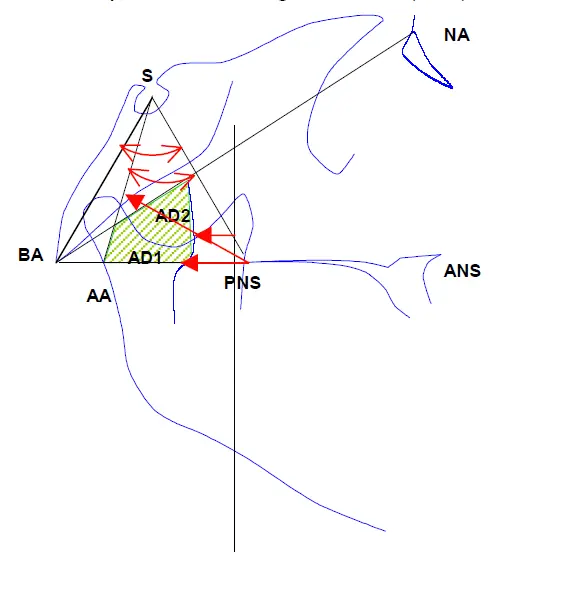
| Measurement | Male | Female | ||
|---|---|---|---|---|
| 6 Years | 16 Years | 6 Years | 16 Years | |
| Airway Percent X S |
50.55 15.85 |
63.96 12.80 |
50.99 13.49 |
62.68 16.09 |
| D-AD1:PNS X S |
20.66 5.50 |
26.48 5.45 |
14.74 5.69 |
26.32 4.28 |
| D-AD2:PNS X S |
15.89 3.53 |
22.44 4.26 |
14.93 3.52 |
21.78 4.67 |
| D-PTV:AD X S |
7.07 3.84 |
14.59 6.10 |
7.02 3.87 |
14.56 4.70 |
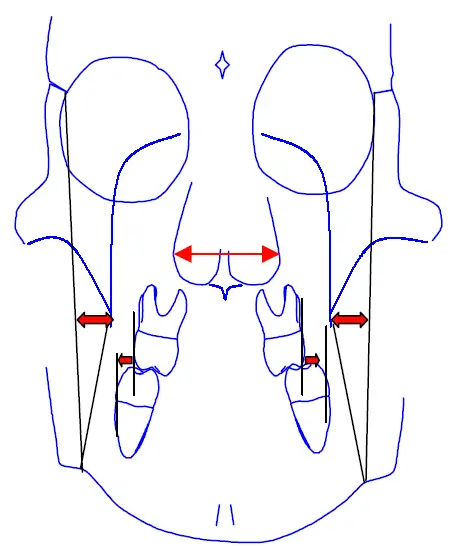
Wertz reported that breathing was most important in those patients who had an inadequate nasal cavity width. Analysis of the Foundation for Orthodontic Research palate separation sample showed that the width of the nasal cavity was increased by palate separation with the effect being most pronounced and the longest lasting at an early age. A later evaluation of the same sample by Bushey showed that those cases in which palate separation was most stable were those with deficiency of maxillary width compared to the mandible before treatment.
Inadequate airway due to nasal resistance can be improved through palate separation. Studies performed at the University of North Carolina reported a 45% improvement in nasal resistance through palate separation (average), provided adenoid obstruction was not present.
However, what if the airway is blocked by the adenoid? If the analysis indicates a severely blocked airway, palate separation, or allergy treatment would not have a good prognosis. If all four measurements indicate that the adenoid is too large for the airway (at least one standard deviation off), there would be a 98% chance that the patient was a mouth breather due to adenoids. Here a complete or partial adenoidectomy would seem to be the only solution.
The computer will analyze each case received for potential adenoid blockage of the nasopharyngeal airway. Messages regarding airway condition are based on the number of airway measurements more than one standard deviation below normal.
| Number of Standard Deviations Below Norm | Adenoid Classification |
|---|---|
| Zero – One | No adenoid problem |
| One – Two | Possible adenoid problem |
| Two – Three | Probable adenoid problem |
| Three – Four | Definite adenoid problem |
There was a time when tonsils and adenoids were removed routinely and the clinician found the pediatrician compliant to the request for removal. However, it has been shown that the tonsils and adenoids are composed of lymphoid tissue which generates antigens and removal actually increased susceptibility to illness. Having a norm for the size of the adenoid might allow for a strategy of partial adenoidectomy.
If only that amount of tissue necessary to attain a normal percent of airway were removed, the lymphoid system might be unhampered, especially since the tonsils could remain intact. Therefore, using modern cephalometric techniques, the orthodontist is able to give an effective diagnosis to select between the alternatives of:
This beginning points the way to a future where the practice of orthodontics will be enlarged to include not just the straightening of teeth, but a complete oral health diagnostic service.
As previously discussed, it is critical to keep long-term results in mind during orthodontic treatment. Other long range considerations include third molar impaction, stability, and relapse.
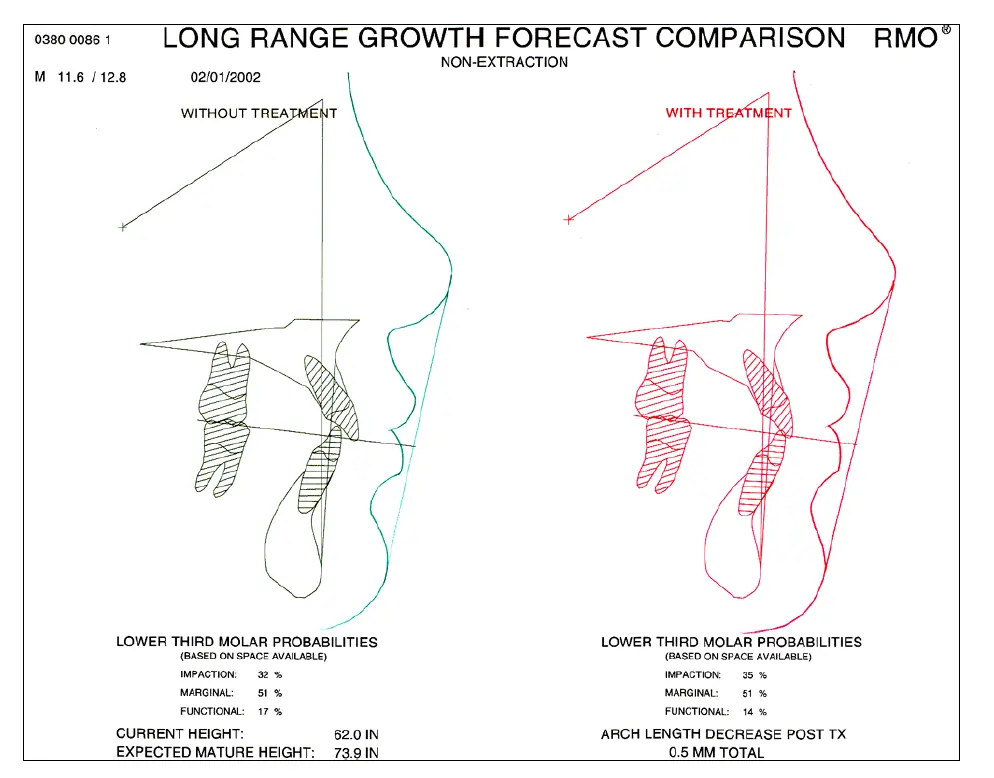
This section consists of an overview of the process in which the computer modifies the growth forecast without treatment to produce the computer VTO. To produce a realistic prediction the computer takes into consideration:
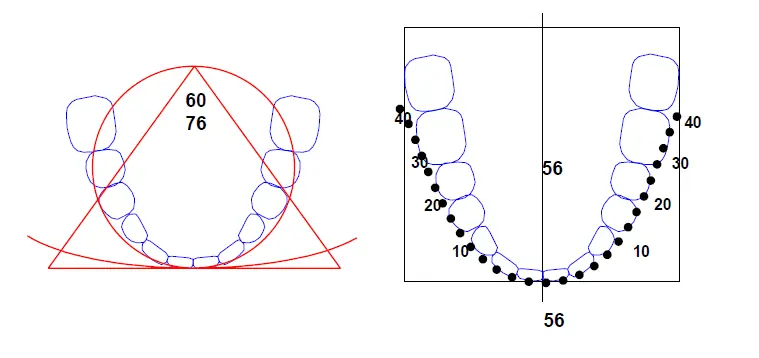
Throughout dental history various families of curves have been proposed which are said to describe lower arch forms of nearly all patients. Two of the best known are the Brader arch and the Bonwill-Hawley arch. In some cases these arch forms have fit patient arches adequately, but in other instances they have not corresponded to patient's arch dimensions. Several reasons for these inconsistent results merit discussion.
Most arch types are based upon a one-parameter curve. A two-dimensional, one-parameter curve is a curved line whose equation can be written in a form wherein the dependent variable, y, is a function of variable, x, and a constant. This constant is called a parameter.
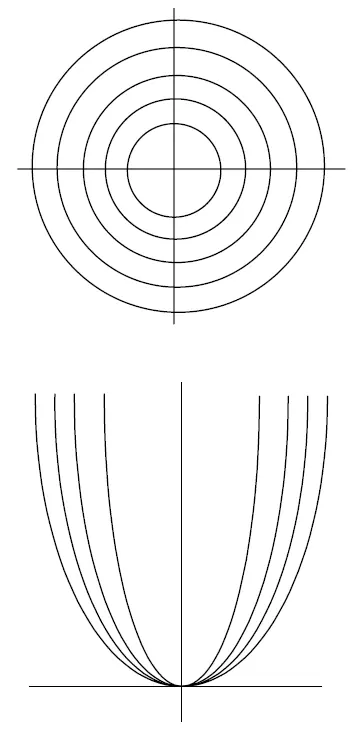
An example of some one-parameter curves is the family of curves as follows:
X2 + Y2 = r2 or (Y = ± √(r2 − X2))
These circles all have their center at the origin of a Cartesian coordinate system. The only difference among circles is overall size. The parameter, r, is a size determining parameter (the radius of the circle).
Another example of a family of one-parameter catenary curves is the family of parabolas, y = ax2. All members of this group have their lowest point at y = 0. Both ends of each curve extend all the way to y = ∞. Therefore, these curves all have the same size, but as can be seen, each parabola has a different shape. Therefore, "a" is a shape parameter.
The human dental arch varies in both size and shape. Therefore, no single parameter family of curves can adequately describe all possible arch forms. For this reason, the computer analysis uses a two-parameter curve.
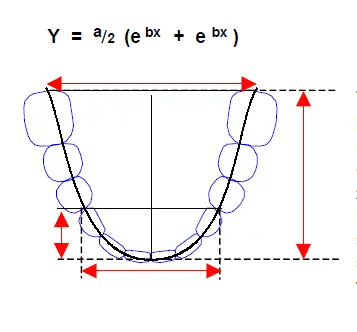
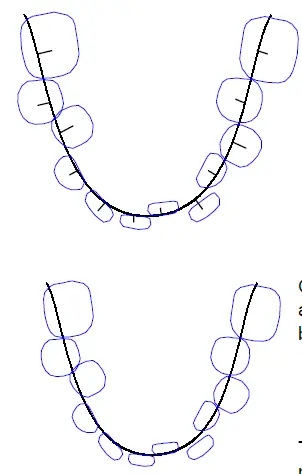
The computer analyzes the occlusal view of the lower arch prior to treatment in order to define a curve that best represents the arch form. The family of curves used by the computer is the set of two-parameter catenary curves:
Y = a⁄2 (ebx + e−bx)
An example is shown here. Unfortunately, unlike the curves above, neither parameter controls strictly size or shape. Each parameter has some effect on size and shape. The two-parameter catenary curve has been found to provide an adequate fit to virtually all lower arches.
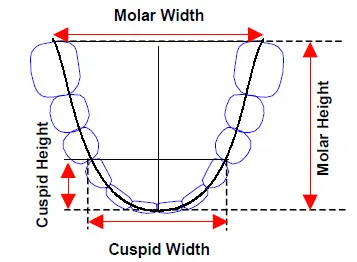
The computer finds the proper catenary (CAT) curve as follows:
1. Five "CAT" points on the arch are noted. These points are the distal points of each molar, the distal points of each cuspid, and the point of intersection of (or mid-point between) the two central incisors. From these points the lower arch height and width at the molars and height and width at the cuspids are calculated.
2. A unique catenary curve is determined by these measurements. This curve is the starting point for computer calculations.
3. The center of each tooth is found and the distance from each center to the curve is calculated. These distances are summed.
4. Alternate catenary curves with equations similar to the initial curve are selected. Distances from the teeth to the curves are calculated. The curve for which the sum of distances from tooth to curve is minimized becomes the new best-fitting catenary curve.
5. Arch symmetry is checked. If the arch is sufficiently asymmetrical, two best fitting curves are found -- one for the left side of the arch and one for the right side.
Once the appropriate catenary equation for the untreated lower arch is found, the length of the curve segment between the distal borders of the first molar on each side is calculated.
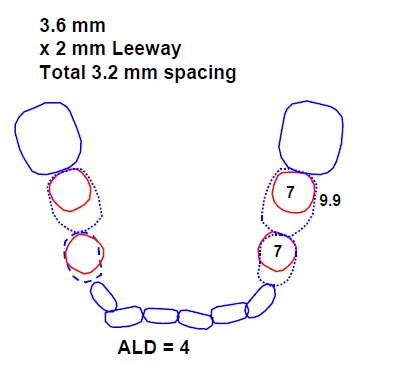
Then the mesiodistal width of each tooth from first molar to first molar around the lower arch are calculated and summed. The difference between the length of the curve and the sum of the tooth widths is the arch length discrepancy (ALD).

In mixed dentition cases, calculating the ALD with the computer becomes more difficult since leeway space must be considered. Numerous studies have been performed in which predictions of the size of non-erupted permanent teeth were made by assessing the teeth currently appearing in the patient's mouth. Most of these methods involve ratios or equations. It has been shown that for each racial group different prediction formulas apply. The information found in these studies is well suited to computer analysis. Thus, the FMBODS computer is able to calculate leeway space fairly accurately on a case-by-case basis. Once leeway space has been calculated, effective ALD can be found from the equation:
Effective ALD = ALD + Leeway Space
Once the effective ALD has been calculated the computer may consider arch length and the frontal tracing in order to determine the need for arch expansion.
After the computer determines the required expansion, lower incisor, and lower molar positions for the VTO, five revised CAT points are calculated which represent the new arch form. A new catenary curve as defined by the CAT points is calculated. The permanent lower teeth are aligned with no overlap along this arch. The resulting drawing is the lower arch VTO.
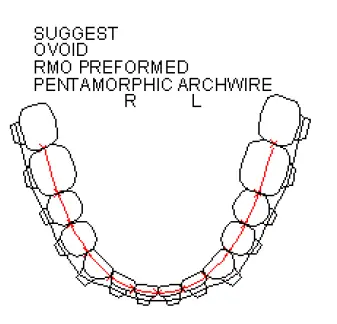
There are three basic ways to increase lower arch length. One method, which relates to the frontal tracing, is expansion of the lower arch.
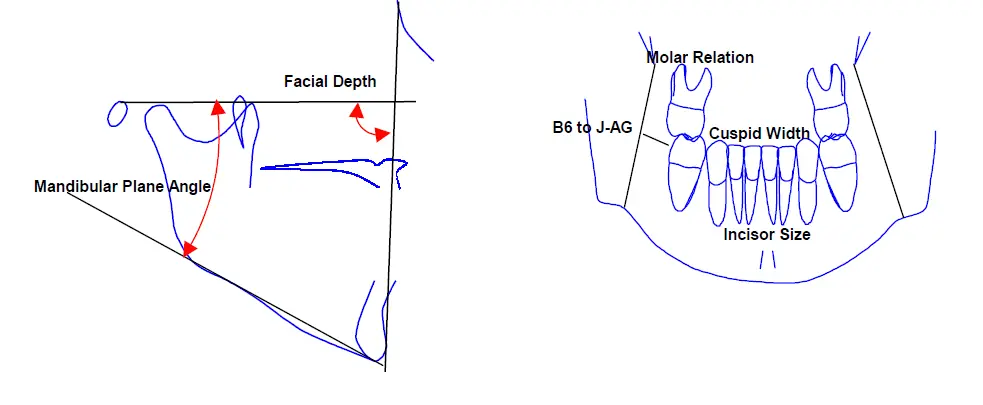
Expansion, as evaluated by computer, focuses on two areas, the cuspids and first molars. The measurements that affect the possibility of expansion can be categorized into several groups--facial pattern, dental, and frontal skeletal-dental relations.
It has been shown that brachyfacial patients can usually accommodate wider arch forms than dolichofacial types. Two measurements that have been found to be most important are Mandibular Plane and Facial Depth. In order for a treated case to remain stable, Cuspid Width must not exceed a maximum value which is a function of Mandibular Plane and Facial Depth. Therefore, each patient has his own maximum cuspid width as related to facial pattern.
Studies have also indicated that maximum allowable cuspid width for a case is related to the sum of mesiodistal widths of the four lower incisors. Cases with wider incisors also tend to exhibit greater cuspid widths.
Frontal Molar Relation plays an important role in the determination of the advisability of lower arch expansion. Cases in which the lower molars are end-on-end to, or located more buccally than the upper molars are not suited for expansion. It is especially true if the Maxillary Width is already great, thereby precluding the possibility of upper arch expansion.
The Molar-to-Jaw frontal measurement is another important factor to be considered. Cases in which the distance between the lower molar and J-AG plane is lower than normal probably cannot tolerate lower molar expansion, while cases for which this distance is great can tolerate a molar width increase. Of course, this is dependent on the width of the supporting structure.
Expansion related measurements considered by the computer are pictured.
New cuspid and molar "CAT points" are calculated on the basis of the amounts of cuspid and molar expansion. The incisor CAT point is assumed to remain stable. A new two-parameter catenary curve is then calculated from the five new CAT points. The length of the new curve is then determined. The difference between the lengths of the original and new catenary curves is the increase in arch length resulting from lower arch expansion.
Upper arch expansion must be based initially upon the treated lower arch as found on the VTO. Ideally one would desire an upper arch that exhibits normal transverse, molar, and cuspid relations with the lower arch. However, two additional considerations must be taken into account. Maxillary Width and Maxillomandibular Relations should be made as normal as possible.
At times upper and lower arch expansion goals may be in conflict. In these cases the computer must compromise previous calculations and create a new expansion plan. After lower incisor and lower molar sagittal positioning are established in the VTO, some or all possible expansion may not be necessary. In these instances the computer will recalculate the final amount of expansion based on the requirement of producing a VTO with no ALD.
A final area of computer frontal tracing analysis is asymmetry. The frontal measurements Denture Mid-line, Maxillomandibular Mid-line, and Denture-Jaw Mid-lines must be evaluated. Any VTO and hence any resulting treatment plan must include the attempt to establish frontal symmetry if possible.
Patient age is of maximum importance in the computer Growth Forecast Without Treatment. However, age must also be considered when the growth forecast is modified by computer to become a computer VTO. The primary role played by patient age in VTO construction is as a limiting factor on orthopedic and orthodontic change that can be accomplished.
Convexity reduction is far more difficult to achieve as the patient's age increases. Convexity reductions of up to 8 mm have been reported for eight-year-old children. However, decreases of more that 2-3 mm are rare in older patients. The computer must consider patient age in determining the mount of convexity reduction shown on the VTO.
Extreme dental changes are also more difficult to accomplish in older patients. Limits on the amount of intrusion, extrusion, advancement, and retraction of the dentition become stricter as patient age increases. These limitations are not necessarily mechanical limitations. Functional considerations, i.e., temporomandibular joint, periodontal, dental, etc., affect these limits, as does the consideration of post-treatment stability.
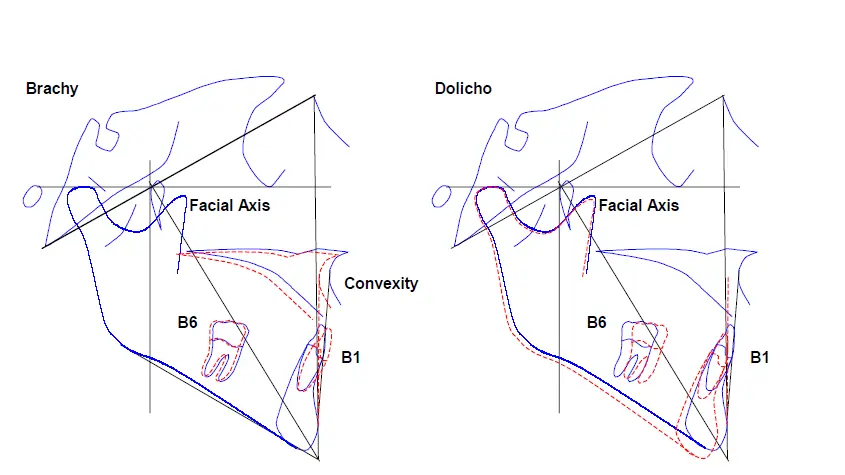
Facial type is an important consideration in VTO planning. Various situations occur in which dolichofacial patients may react differently than brachyfacial patients to the same treatment.
One example of this phenomenon is the use of mechanics to rotate the Facial Axis. It is far easier to rotate the mandible open in a vertical pattern than a horizontal pattern. Unfortunately, the vertical pattern is the case in which closure is frequently desired. Conversely, brachyfacial patients, who usually have high Facial Axis, frequently resist orthopedic and orthodontic attempts at mandibular opening. Theoretically, differences in musculature tend to account for these difficulties. Brachyfacial types exhibit powerful masseter, temporal, and pterygoid muscles that resist mandibular change, as opposed to weak muscles seen in dolichofacial cases.
Most conventional mechanics tend to open the facial axis. In particular, convexity reduction, molar relation correction, overbite correction, and crossbite correction are key contributors to this condition. The amount of opening as a result of these mechanics is highly dependent upon facial type. The computer uses the patient's VERT number to project mandibular change accurately.
Another result related to facial type is the ability to position the lower incisor tip more labially in brachyfacial cases. Lower central incisors in brachyfacial Caucasian patients can frequently be placed such that the tip is a +3 or +4 mm to the A-PO with stable long term results. In dolichofacial Caucasian patients, a lower incisor to A-PO beyond +1 mm may result in relapse to lower anterior crowding. For this reason more brachyfacial than dolichofacial patients can be treated non-extraction. The computer must consider the value of VERT in determining lower incisor positioning.
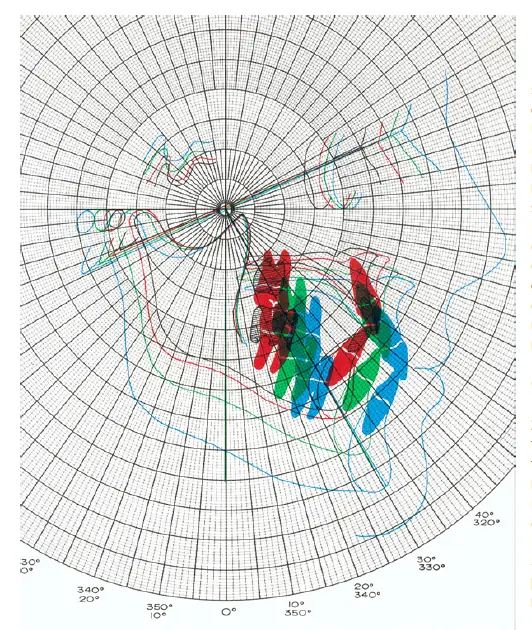
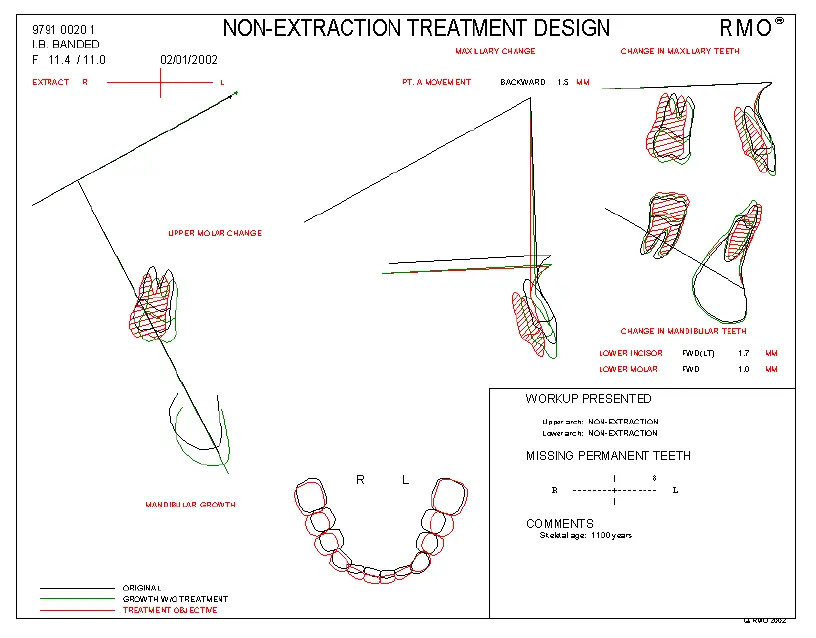
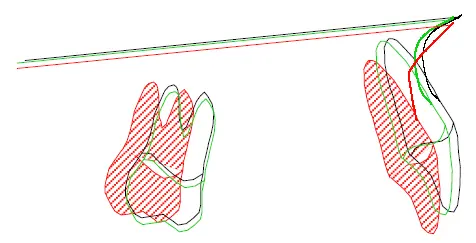
The Treatment Design Chart is the cephalometric equivalent of a construction blueprint. This chart illustrates in a concise fashion the current malocclusion, expected growth, and desired treatment result. The Treatment Design shown was generated by computer. The main feature of the Treatment Design Chart is the illustration of five areas of superimposition. For superimpositions the following color scheme is in effect: Black equals the original tracing; green, the growth forecast, without treatment; and red represents the VTO.
These superimposition areas are used to describe facial change in five areas:
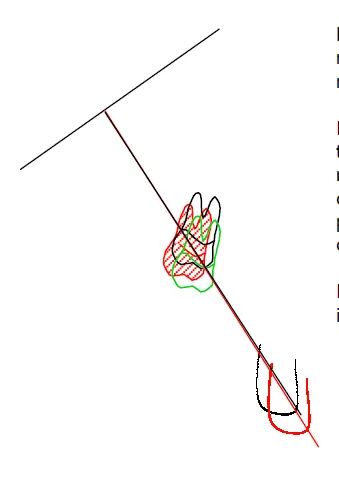
Basion-Nasion at CC Point is used to evaluate the upper molar change in the position of the chin as a result of the mechanics utilized.
In typical growth the first molar and chin grow directly down the Facial Axis. The Facial Axis rotates open or closed as a result of various factors such as convexity, reduction, correction of molar relation, overbite correction, facial pattern, crossbite corrections, etc. The Facial Axis may close with extraction.
In contemplating head gear use, one must think of the effect it may have on mandibular rotation.
Basion-Nasion at Nasion is used to evaluate maxillary change resulting from mechanics. In normal growth the BA-NA-A angle does not change. Here it can be determined whether to use an orthodontic or an orthopedic force on the maxilla with a head gear.
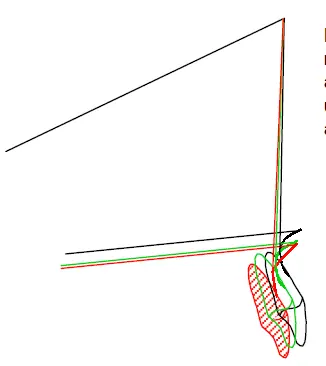
This superimposition area, Corpus Axis at PM, can be used to evaluate any changes that take place in the mandibular denture. In normal growth the lower denture remains constant with the APO Plane. In Evaluation Area 3 we evaluate change to the lower denture. This helps to determine what type of mechanics to use.
In Evaluation Area 4 the lower molars are evaluated to determine what type of anchorage is needed and whether to advance, upright, or hold the lower molars.
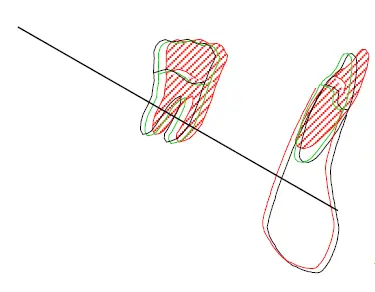
This superimposition area, the Palate at ANS, is used to evaluate any changes that take place in the maxillary denture. In normal growth upper molars and upper incisors grow on the polar axis. In Evaluation Area 5 one can evaluate the upper molar treatment anchorage requirements (hold, intrude, extrude, distalize, or advance).
In Evaluation Area 6 one evaluates what upper incisor movement is required.
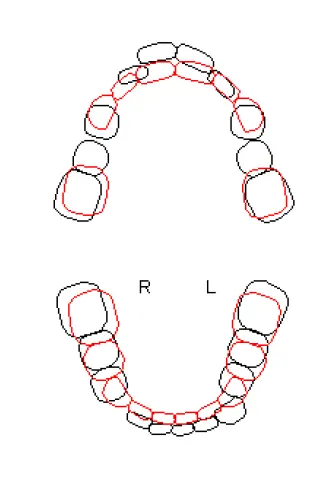
The occlusal view of the lower/upper arch is used to evaluate desired dental change in both the mesiodistal and buccolingual dimensions. Precise changes necessary for all teeth on the arches can be evaluated in detail. The computer does not provide a lower/upper arch rendering for the Growth Forecast Without Treatment.
As with construction blueprints, the Treatment Design contains numeric values that precisely define key required changes. Amounts of change for the lower incisor, lower molar, and convexity reduction are listed directly beneath the appropriate drawing.
The extraction decision is also printed on the work-up rationale sheet. The notation used is as follows:
Numbers from four to six may be written in quadrants defined by the intersection of two perpendicular lines in the upper left corner of the page. The four quadrants represent the four quadrants of the upper and lower arches.
| Upper Right | Upper Left |
| Lower Right | Lower Left |
Four blank quadrants indicate no extractions. The numbers of four through six are standard dental notation referring to the teeth:
The numbers found in each quadrant relate to this numbering scheme. For example, the following notation indicates both upper second and lower first premolars are to be extracted:
| 5 | 5 |
| 4 | 4 |
The position of the lower incisor has been recognized as the key to orthodontic diagnosis and treatment planning due to its effect on esthetics, stability, and space available in the mandibular arch. The purpose of this section is to compare various theories and rules for positioning the lower central incisor.
Most studies of stability of the lower incisor center on one of two topics:
In the past, it has frequently been stated that anterior movement of the lower incisors should be avoided at all cost. Preferably, incisors should remain in their pre-treatment positions.
Hixon concluded that the majority of cases in which the mandibular arches have been advanced will relapse to the original position. If crowding is present in the lower arch, extraction is the only treatment that will provide a stable result.
Weinstein felt that the teeth are in a state of equilibrium with the musculature. Thus, the lower incisor should be placed near its original position. Miller expressed the same opinion; if treatment results are to remain stable, the teeth should be placed within the form of the dental arch as presented.
As time passed more sophisticated analyses showed that in many cases the lower incisor could be moved. The secret was to predict properly lower incisor placement prior to treatment on an individual case basis.
Posen measured perioral musculature and found that the strength of the musculature was correlated with the position of the incisors. Class II, Division 2, cases had the strongest perioral musculature; Class I bimaxillary protrusion, the weakest. He also observed that in treatment a change in the oral environment as a result of normal denture position was accompanied by a change toward normal to create a more normal lip tonicity and hence to reduce the chance of incisor relapse.
Several authors have proposed that severing supra-crestal and transeptal periodontal fibers helps prevent lower incisors from returning to their original positions. This procedure is especially helpful in preventing dental rotations.
Solow found that the upper central incisor inclination was positively correlated with the length and the prognathism of the mandible. He also found the lower central incisor inclination to be positively correlated with the length of the maxilla. Increase in prognathism was compensated for by a forward tipping of the lower incisors.
A study of incisor inclination by Linder-Aronson on 60 patients indicated a significant correlation between the angle ANB and the inclination of the lower incisors, regardless of whether the measurement is made to the NB or the ML line. He concluded further that "A correlation between lower incisor inclination and the basal jaw relationship (ANB) has also been established."
Peck and Peck have noted the somewhat autonomous behavior of the lower incisors in that they are often seen to relapse, even in lower premolar retraction cases. Postulating that aberrance in anterior tooth morphology is critical to the etiology of this relapse, they formulated a morphological index of incisor size and shape:
Cases in which the incisors were exceptionally wide mesiodistally were more inclined to relapse.
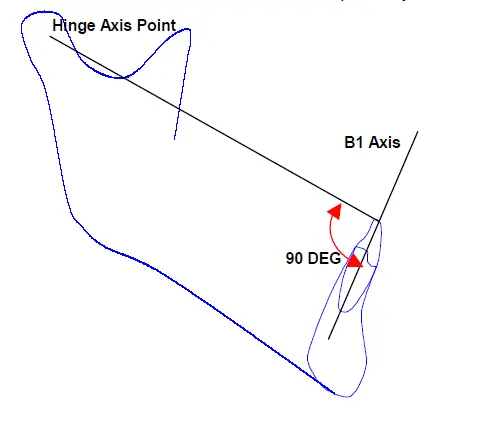
A master's thesis at the University of Tennessee tested the concept of treating the lower incisor to the proper hinge axis angle. It was found that cases in which the hinge axis angle was treated to a value of near 90 degrees tended to enjoy stable lower incisors in the post retention period.
Ricketts found that the lower incisor to APO was a reference that aided lower incisor repositioning. In another paper it was found that cases treated to near +1 to APO and an angle of 22 degrees to APO seemed to remain stable, while cases that diverged from these values tended to relapse.
A FOR study found that excessive mesiodistal width of the lower incisors led to anterior relapse only when the mandible was too short and narrow to accommodate large teeth. Patients with brachyfacial, square jaws and long corpi are able to afford wider incisors than are those with dolichofacial, vertically angled jaws. It was determined that patients exhibiting large mesiodistal lower incisor widths in vertical facial patterns may be excellent candidates for interproximal stripping.
The information in the FMBODS computer that is used to determine the treated lower incisor configuration which will provide the optimally stable result is based on the work of Ricketts. A recent study performed at FMBODS reconfirmed the validity of placing the lower incisor at +1 mm and 22 degrees to APO. The APO line is logically an excellent cephalometric choice in determining incisor position as it relates the lower incisor position to both the mandible and maxilla.
Three methods that are frequently used to alter the amount of space in the lower arch are changing the position of the incisors; movement of the first molars; and buccal expansion of the cuspids, premolars, and molars.
At this point, we examine the possibility of buccal expansion in the mandibular arch. Specific attention will be focused on two questions. Can the position of the cuspids, premolars, and molars be altered without adversely affecting their stability? Are there useful norms for cuspid, premolar, and molar widths that can be used as a guide to enhance stability of results and minimize the need for extraction?
A recent study by Gardner and Chaconas sheds some light on the first question. A random sample of treated malocclusions with post-treatment records averaging approximately seven years subsequent to active treatment showed the following in non-extraction cases:
It appears that molars are expandable on the order of 2 mm with little relapse. While cuspids showed almost 60% relapse when expanded slightly over 1 mm, considerable variation in stability was noted from patient to patient. Some cases held and some relapsed.
The stability of molar width is in contradiction to McCauley, Litowitz, Dona and Welch. Walter, however, concluded that mandibular arch width can be permanently increased. He found that in non-extraction cases 72% maintained an average of 1.8 mm intermolar width.
Cuspid relapse was shown to be an average of 58.5% by Gardner, which is comparable to the conclusions of Reidel that these teeth cannot be permanently expanded. However, Reidel has reported the possibility of cuspid expansion in Class I, Division 2, cases. Strang related that the intercanine width of the mandibular denture is an infallible guide to the muscular balance inherent in the individual. The width dictates the limit of denture expansion in the cuspid area. Dona has also concluded, as have Welch and Arnold, that the intercanine widths tend to remain the same or return to the original dimensions if expansion is attempted during treatment. Walters, again contradicting the findings of others, found that 62% of the non-extraction cases maintained an average increase of 2 mm of intercuspid width. Steadman could not reach a conclusion.
Very little appears in the literature to indicate that premolars cannot be expanded. Litowitz reported that expansion between the first premolars resulted in little tendency for relapse and, in fact, frequently resulted in arch width increase.
Three independent research projects were initiated, all dealing with the concept of establishing a norm for buccal expansion. One article that summarized these three studies also exists. The order of presentation here of the three studies is chronological since the results of the first investigation prompted the second and the results of the second spawned the third.
Schuler derived a norm for buccal expansion of molars based on individual patient cephalometric measurements. After deriving a general norm for intercuspid width, he demonstrated that patients expanded past the norm show a greater propensity toward relapse.
Lestrel then derived a norm for cuspids and first premolars would be a function of the individual patient. It was Lestrel's objective to derive a norm for the contact point between the cuspid and the first premolar that could be used as a treatment objective, minimizing relapse.
Schuler selected a sample of expansion cases that included frontal and lateral head plates and orthodontic models at beginning, end-of-treatment, and post-retention. Seventy-two individuals, 34 males and 38 females, were chosen. He divided them into two groups, those whose molars expanded or remained the same after treatment, and those whose inter-molar width decreased. Measurements of intermolar width were made using the frontal head film in each case. Fifty computer measurements were made for each patient. Standard variations from the computer norms were evaluated at each point.
Two variables emerged as significant; one from the lateral cephalogram and one from the frontal. The cases in which molar expansion held had on the average a shorter lower face height prior to treatment. In the frontal x-ray significant differences were not noted between the two groups before treatment. However, at the end of treatment the measurement molar-to-jaw showed significance.
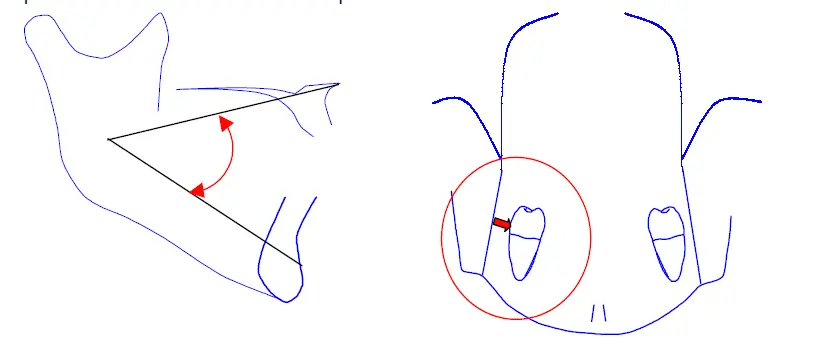
Moreover those cases in which molars relapsed had significantly less space between the lower molar and the J-AG plane at the end of treatment than those which held.
The prime importance of this measurement may be in detection of over-expansion of the molars compared to the width of the jaws. This implies that each face has an ideal molar-to-jaw relationship and that molar expansion would be used only to achieve that relationship. It is consequently possible to conclude that available expansion is defined by the molar-to-jaw distance. The facial pattern, as defined by lower face height, can be used to reduce the risk of relapse when molar expansion is considered.
Schuler made the same type of sample division to analyze cuspids. He compared patients who showed relapse and those who did not. He found post-treatment intercanine width to be highly correlated with eventual cuspid relapse. Cases having large end-of-treatment intercanine widths generally relapsed, while cases with small intercanine widths actually increased in width years later. These results suggested the possibility of a norm that could be used as a guideline to minimize the chance of post-treatment relapse.
These norms would be based on individual characteristics such as tooth size and facial pattern.
Two samples were chosen. The first was sample of 50 normal occlusions. All such cases showed less than 1 mm of crowding. The second sample consisted of 67 stable orthodontically treated cases. All cases to be considered stable had to show less than 1 mm post-retention crowding. These were then subdivided into 24 extraction cases and 43 non-extraction cases.
A step-wise multiple regression analysis was performed on the treated sample to relate the dependent variable, arch width (measured at the distal contact of the cuspids), to the independent variables: (A) Incisor mass: sum of mesiodistal diameters of the four lower incisors; (B) Mandibular width: the distance between the left and right antegonial notches; (C) Mandibular plane angle; (D) Facial angle.
The regression analysis showed incisor mass, facial angle, mandibular plane, and mandibular width to be of importance.
In the normal occlusion sample, the mean measurement at the distal of the cuspids was 28.5 mm with a standard deviation of 1.48 mm, a small variation. In addition the mean combined incisor width was quite small and the average facial pattern tended toward brachyfacial. Dolichofacial patterns with normal occlusions were quite rare (only 3% of the sample). These figures lead to the conclusion that a normal occlusion usually required both small teeth and brachyfacial skeletal pattern.
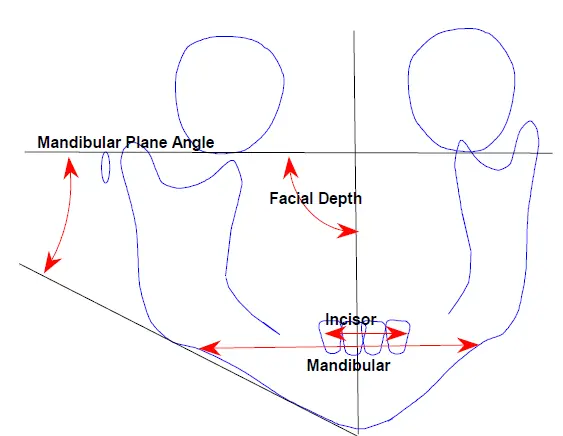
In the treated sample, facial pattern became more important and tooth size less important in the normal occlusions. The step-wise multiple regression results showed that the width at the distal of the cuspids was remarkably smaller for these samples than for Schuler's relapse group.
Upon the basis of these two studies, a formula was derived that might be useful as an individual norm for determining the ideal dimension for the lower arch at the distal contact of the cuspids:
The prediction formula gives a theoretical norm which can be interpreted as follows:
Given a patient's tooth size, mandibular width, mandibular plane angle, and facial depth, the proper width at the distal of the cuspids can be predicted. The formula shows that a patient with a brachyfacial pattern, i.e., wide mandible, low mandibular plane, and prognathic mandible will have a wider mandibular arch than the dolichofacial patient with a narrow, retrognathic mandible and a high mandibular plane angle.
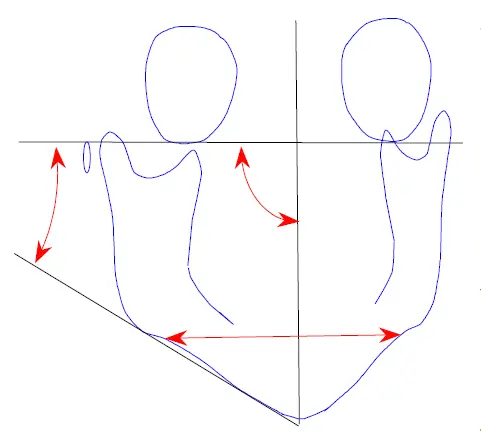
FMBODS tested Lestrel's individualized norm for the distal contact of the cuspids against a sample of treated cases to see if the quantitative norms agree with the actual treated results. Specifically, he wanted to see if relapse was more likely in cases where the expansion exceeded the mathematical norm.
To test this prediction formula, 47 cases with pre-treatment, end-of-treatment, and post-treatment records were selected based on the sole criterion that the width at the distal of the cuspids was increased at least 1 mm during treatment. The sample was divided into three groups:
A statistical F-test was conducted to compare the post-treatment change among groups. Group One and Group Three, the cases not following the norm, were pooled and compared with Group Two which did. There was a significant difference of .025 mm according to this test. Group Two
which followed the computer norm had less post-treatment change and was more stable than the other two groups which did not follow the norm.
A graphic comparison of the three populations offers some significant insights.
The first graph shows the distribution of cases that were treated to within 1 mm of the computer norm. In this group there was the greatest stability -- a full 50% showing less than 1 mm of relapse. There were no cases with more than 3 mm relapse.
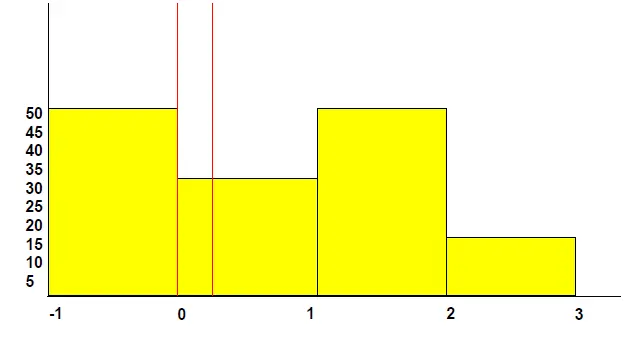
The graph representing the group which was over-expanded compared to the computer norms shows the largest percentage of the cases experiencing relapse of 1 mm or more. This shows a greater propensity towards instability in "over-expanded" cases.
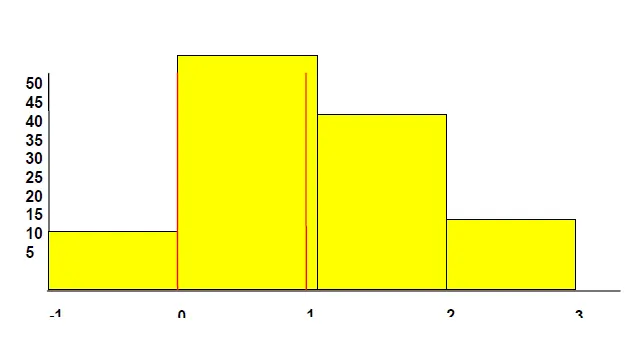
Group Three, undergoing less expansion than the norm, showed a bimodal distribution with one subset remaining stable while another experienced minor collapse. The graph for this group shows a bimodal distribution with one subset centered around 0 relapse and a second subset showing 2-3 mm relapse. This might reflect the greater possibility of relapse when cases are expanded beyond the computer norm, and the possibility of greater expansion, in many cases, when the arch was under-expanded.
We may therefore conclude that cases can safely be expanded to within 1 mm of the individual norm without excessive relapse.
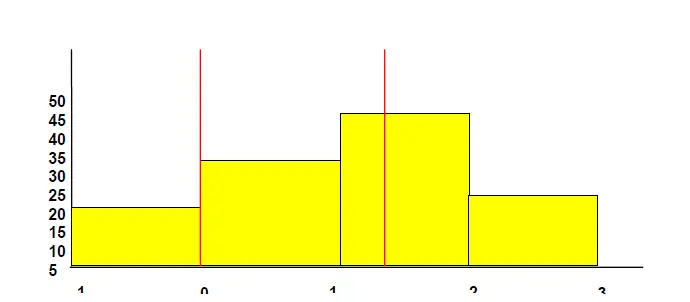
Since the lower arch analysis is the cornerstone of orthodontic diagnosis, the lower arch has been studied more thoroughly than the upper arch. This is especially true in the area of stability. Frequently in performing a manual VTO, once the lower arch set-up is established, the upper molar is placed in a Class I relationship with the lower molars. Similar placements are made for upper cuspids and incisors as well. Often this type of VTO procedure succeeds. However, there are times when conflicts exist between ideal upper and lower arch set-ups. Wide variations in arch length discrepancy between the two arches, differences in arch widths, and asymmetry problems all require special upper arch work-ups. In some of these instances, compromises must be made between upper and lower arch ideals.
One area in which such contradictions are possible is in relating stability of upper arch width to stability of lower arch width. Two studies that deal cephalometrically with stability of the upper arch after maxillary expansion were performed by Ehrler and Frank. Ehrler's study was based upon the use of the jack screw appliance.
Frank's study dealt with quad helix. It is commonly believed that the quad helix is used primarily when buccal tipping of the dentition is the main objective. The jack screw is used when the entire mid-palatal suture is to be expanded.
Ehrler examined ten cases that exhibited lingual crossbite of the arches prior to treatment. After using the jack screw to expand the cases, he found that seven cases remained stable, while three relapsed. He noted that the nasal width was greater prior to treatment for the relapse cases than for the non-relapse cases. However, statistically, there was no significance.
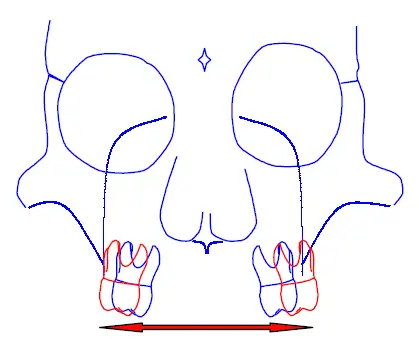
Frank performed a more detailed analysis than Ehrler. He found that an average of 6 mm of upper intermolar width increase was attainable with the quad helix appliance.
Moreover, over 90% of his width increase held after treatment. He also found that only 50% of all cases experienced an increase in maxillary width. However, he found that for cases in which maxillary width was increased during treatment, this increase would be stable only in cases where nasal width was wide compared to maxillary width prior to treatment.
Frank's sample consisted of 20 patients. Therefore, the result of his study should carry more weight than Ehrler's results. Moreover, neither study is complete enough to define completely the effects of upper arch expansion on stability. Hopefully, such a study will be conducted in the future.
On the bases of the research described above, it is presently believed that expansion will be most successful and stable in cases with pre-treatment upper arches that are narrow, especially compared to the lower arch. Upper molars can be placed more buccally without unjustified fear of relapse.
Cases with narrow maxillas can enjoy small but stable maxillary width increase. This is especially true in patients with wide nasal cavities prior to treatment.
The computer considers various types of information including the results of the above studies. Frontal molar relation, upper molar-to-jaw distances, facial type, and maxillary width are all taken into account in the determination of advisability of upper arch expansion.
Stability of upper incisors also has received little attention in the literature. Frequently, studies dealing with this general topic relate stability to the interincisal angle. Such confound the problem of lower incisor stability with upper incisor stability. Several studies have separated these effects.
Damarell found that an equally stable position for the upper incisor is such that the upper incisor is inclined at an angle within five degrees of the facial axis.
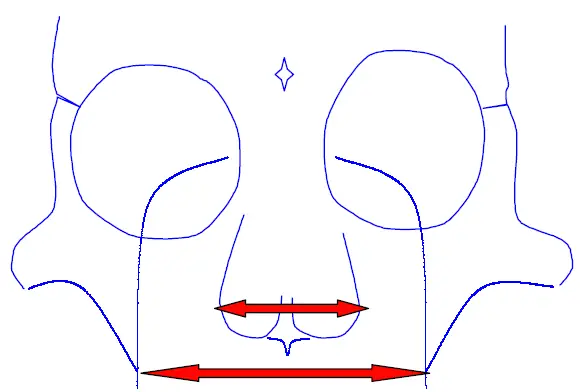
Slavicek claimed that the angle of the upper incisor should reflect the angle of the condylar eminence. It is generally agreed that the upper incisor should be placed such that a 2.5 mm overbite and 2.5 mm overjet exist in conjunction with the ideally aligned lower incisor. The computer used much of the above information in determining upper incisor placement. Again, more study of this topic is required.
Upper molar placement is effected by at least four items — lower molar position, upper molar to PTV, lower arch width, and advisability of upper arch expansion. Ideally, the width of the arch between upper molars should be 3 mm greater than the arch between lower molars. The distance from upper molar to PTV should be the patient's age in years plus 3 mm.
In conclusion, it must be said that stability of the upper dentition is a topic that has been overlooked by a large segment of the orthodontic community. As new information appears the computer consideration of the upper arch will achieve additional sophistication.
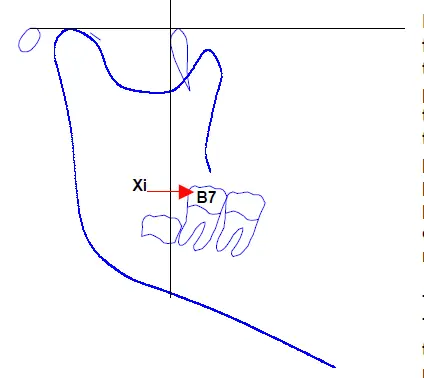
Ricketts suggested using cephalometric head films for diagnosing the probability of impaction of the third molars. He went on to hypothesize that the percentage of width of the third molar, anterior to the external oblique ridge of the mandible, viewed in the lateral head plate, would yield a percentage probability of third molar eruption. Using the principle of arcial growth of the mandible, it was possible to predict the third molar probability of eruption at maturity as early as ten years prior to maturity.
Turley performed a study to test Ricketts' theory. The result of Turley's analysis forms the basis for the FMBODS computer lower third molar impaction probability program. The study was based on 74 orthodontically treated cases. Turley showed that the space available for lower third molars at maturity best may be represented by the distance from Xi point to the distal of the lower second molar. He further has presented probability curves showing the relationship between the probability of impaction, eruption in good occlusion, and eruption with possible attendant problems as a function of the distance from Xi point to the second molar.
A sample of records from the University of Michigan was used to test Turley's results. The error in predicting the eventual space available for lower third molars ten years prior to maturity is ± 2.8 mm, approximately. This is equivalent to 90% accuracy.
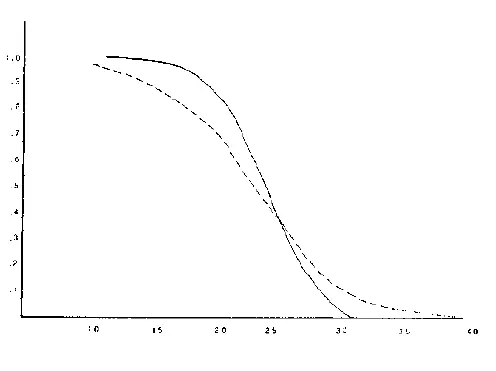
Turley's sample was evaluated on a further sample of adult males. This sample consisted of Foundation for Orthodontic Research members who were willing to take a head plate of themselves and provide their dental history. The previous graph shows the probability of impaction of the third lower molar as a function of the actual distance from Xi point to lower second molar at maturity. This curve is compared with the probability of impaction predicted ten years in advance using Turley's method.
Notice that the curve for the ten-year prediction is quite similar to the curve representing the measurement at maturity. This is a reflection of the high degree to which this distance can be predicted. These findings illustrate a high degree of correlation between the predicted number of impactions using the Turley curves and those actually observed in the F.O.R. sample.